Raspberry Pi Fitness Tracker
May 18, 2022
By Morgan Cupp (mmc274) and Maanav Shah (mcs356)
Demonstration Video
Objective
Fitness trackers are an invaluable tool for people of all ages and lifestyles. These devices make tracking exercise not only easier, but also more enjoyable. This encourages and empowers people to exercise more, increasing their well-being. Unfortunately, most reliable fitness trackers cost hundreds of dollars. With this project, we set out to prove this does not have to be the case.
Introduction
In this project, we created a relatively cheap fitness tracker using a Raspberry Pi 4 and GPS module. By connecting to GPS, the device determines and displays the current date and time. The device allows users to log data on activities they do. Specifically, the device tracks distance traveled, elapsed time, current speed, current elevation, and total elevation gain. When finished with an activity, users can save it to the device’s memory and view its statistics later.
Furthermore, the device summarizes weekly data across all stored activities and presents the summarized data in convenient ways. This includes listing various totals for each week, along with weekly graphs displaying data for the various activities recorded during that week.
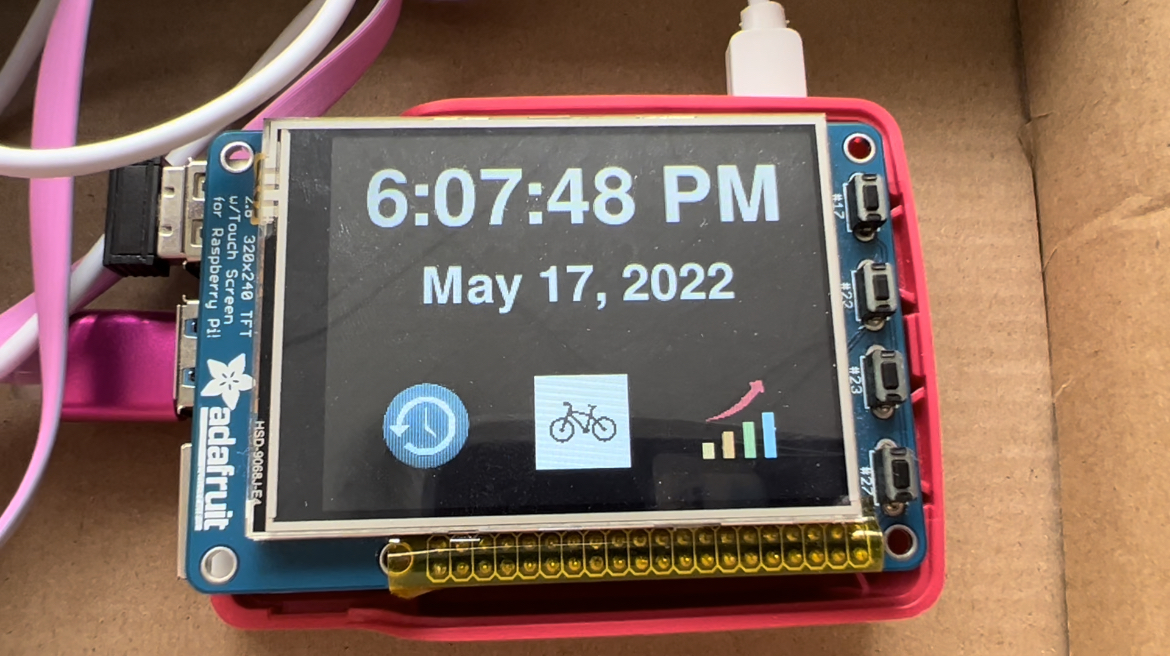
Figure 1: Photograph of our fitness tracker project.
Design and Testing
We began this project by setting up the hardware. This part was rather simple. The hardware components consisted of a Raspberry Pi 4, Adafruit Ultimate GPS Breakout module, Adafruit PiTFT display, and a 5V power bank.
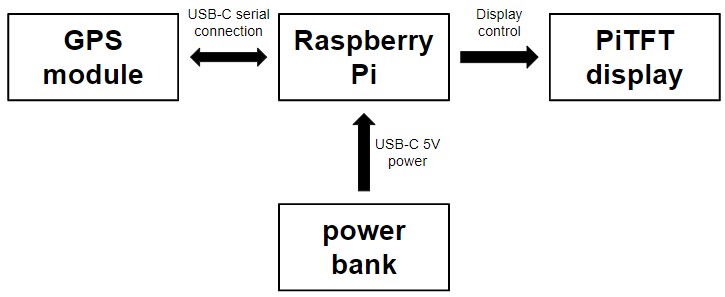
Figure 2: Hardware schematic for the project. The GPS module communicates with the Raspberry Pi using a USB-C serial connection. The Pi communicates with the PiTFT using numerous pre-configured pins on the Pi. An external power bank powers the entire system.
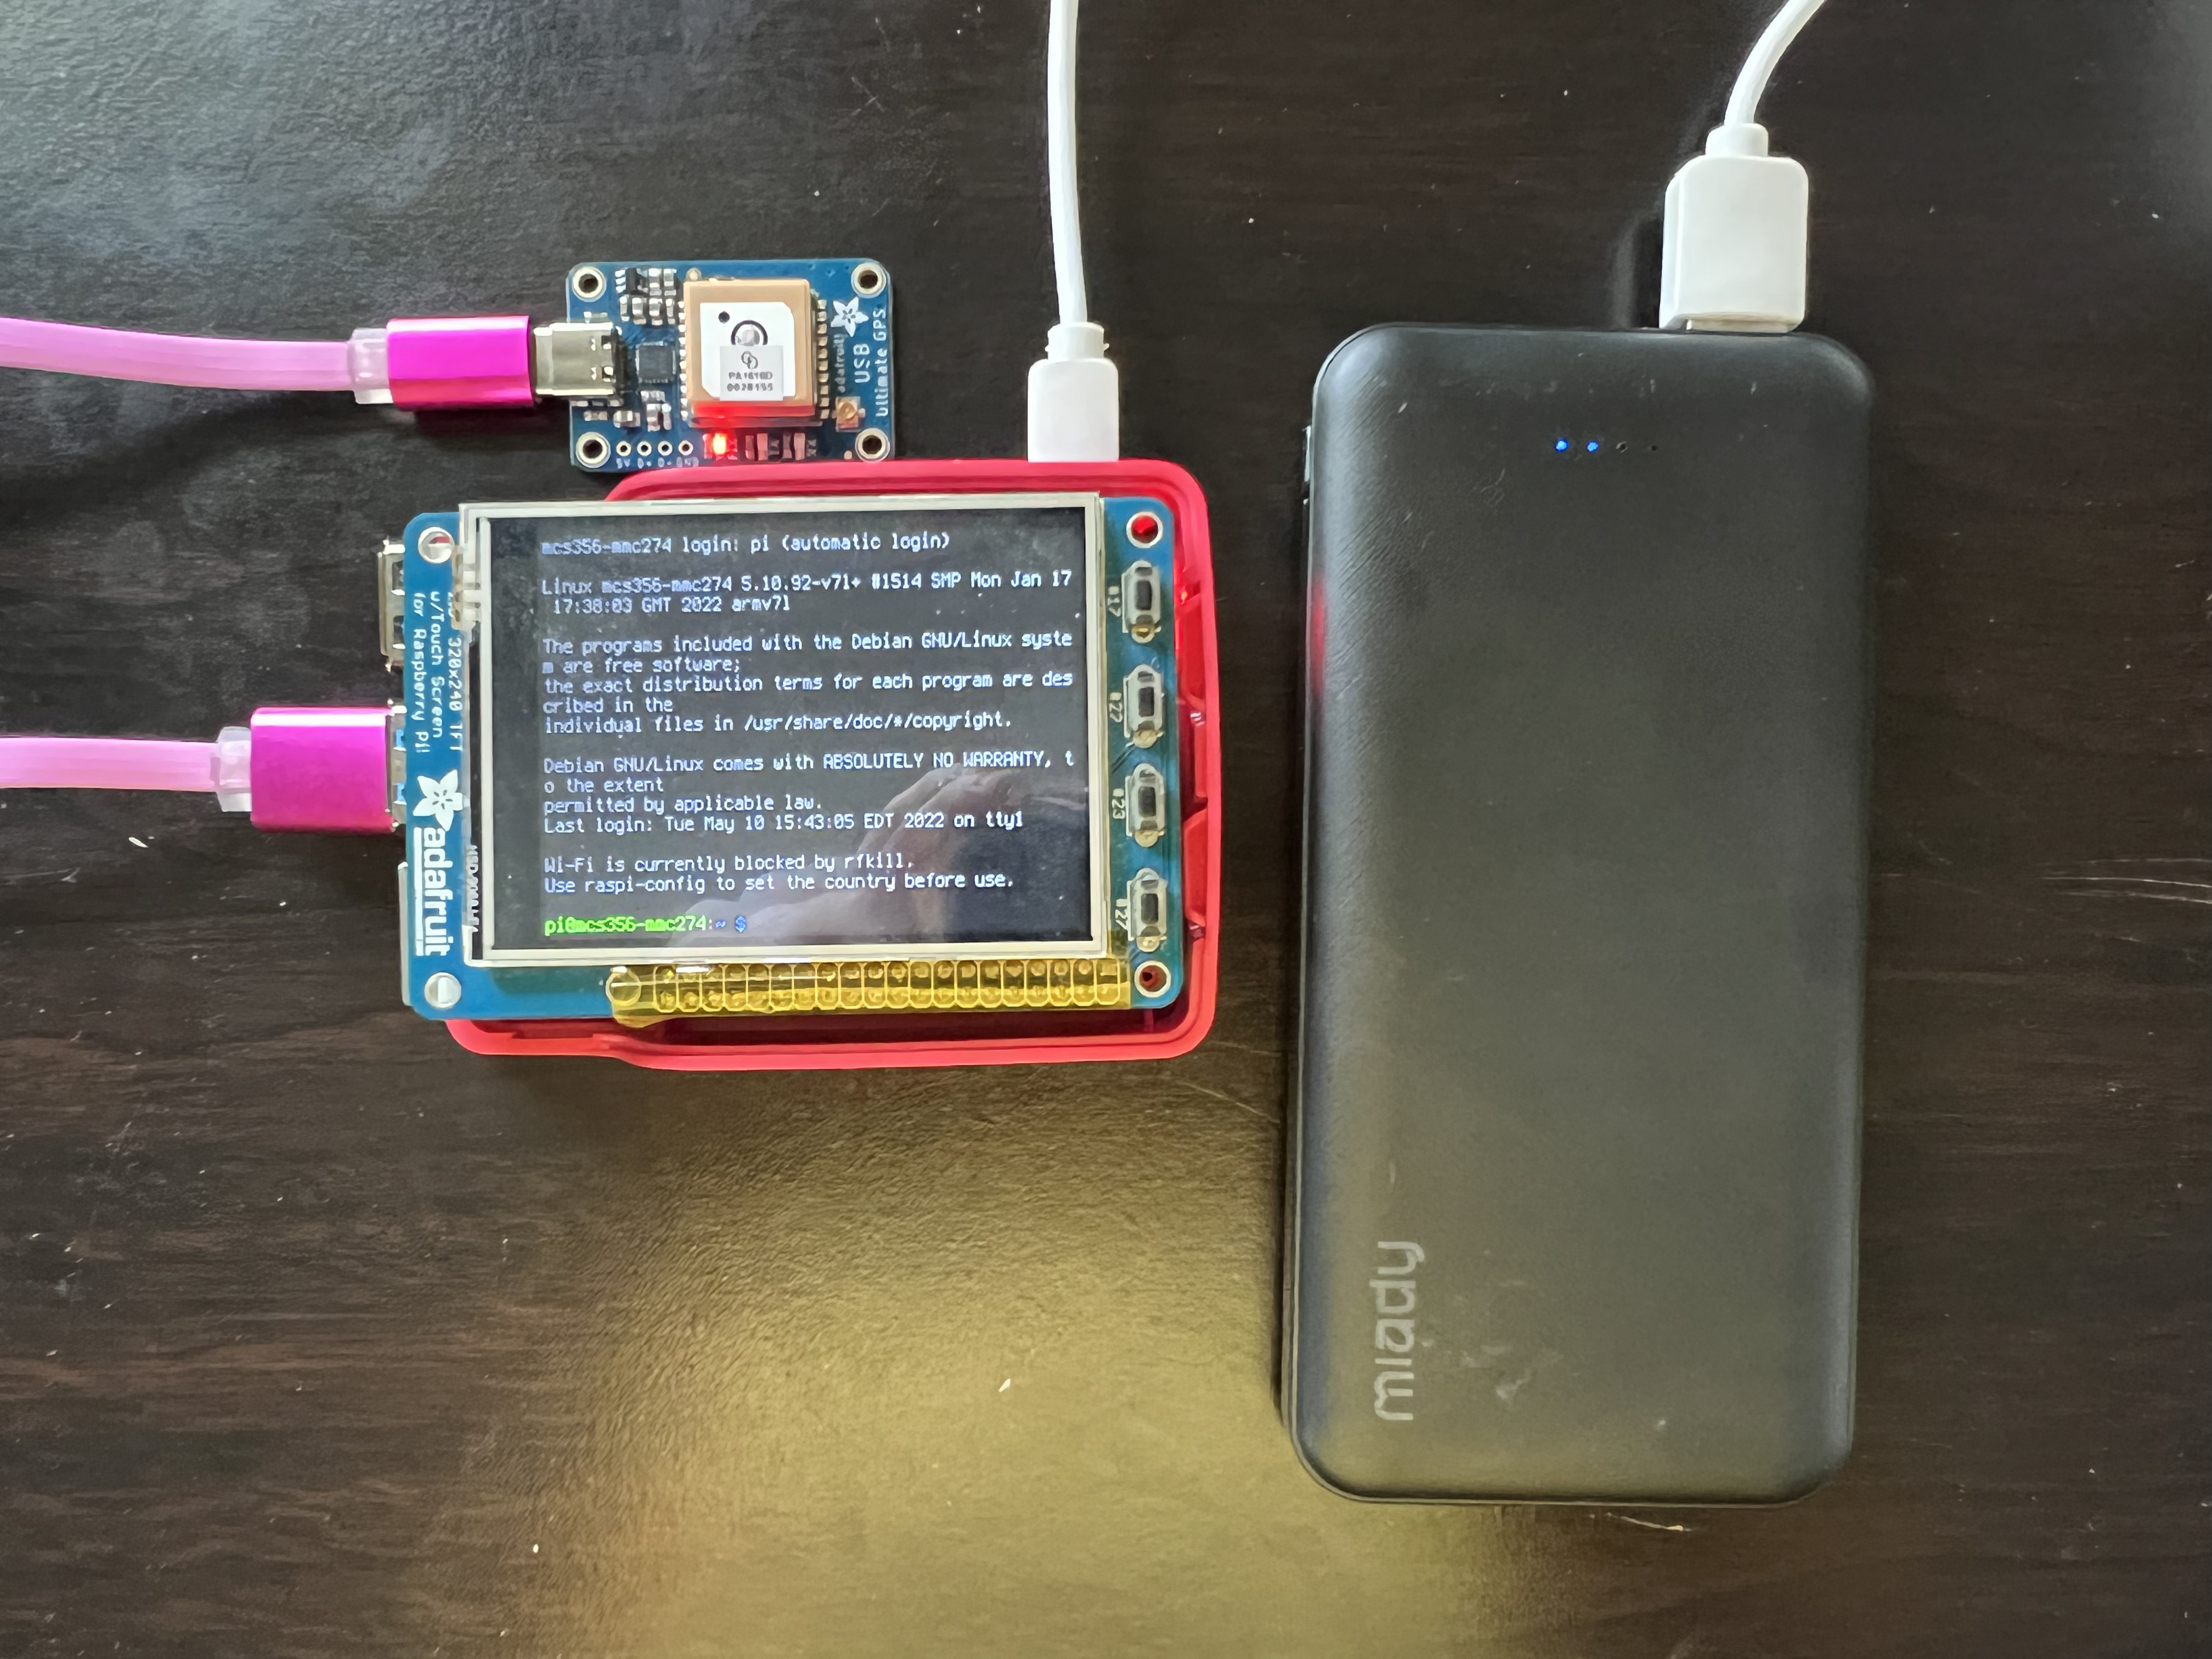
Figure 3: Photograph of the physical system showing the hardware components. The Raspberry Pi 4 is beneath the PiTFT display which is currently showing the Linux command line. The power bank is on the right, and the GPS module is on the upper left.
Setting up the hardware was relatively easy. In the beginning of the semester, the Raspberry Pi’s SD card was configured with the latest Raspbian Linux kernel using provided instructions [1]. The PiTFT was also configured using instructions in the ECE 5725 Lab 1 handout at this time [2]. The only setup left to do for this project was to configure the GPS module. We selected this GPS module due to its position accuracy of three meters, velocity accuracy of 0.1 meters per second, and low power requirement at 25 mA listed on its datasheet [3]. Setting up the GPS module was straightforward as well. We simply had to install two Python libraries using the command line: the Adafruit_Blinka library and Adafruit_GPS library. Instructions for doing these two simple installations were linked to the datasheet webpage [4].
We considered several designs. Our initial goal was to design a wearable fitness tracker that a user could wear around his/her wrist. This would have been possible with the Pi Zero. However, given the size of the Pi Zero, using a touchscreen such as the PiTFT was not practical as it would leave little room for user interactions. We ultimately decided that we valued practical user interaction more than making it portable. Hence, we decided to stick with the Raspberry Pi 4, envisioning our system as something that might be mounted on bike handlebars.
Once these hardware decisions were made, the rest of the project consisted of software development. The high-level functionality of the software is as follows:
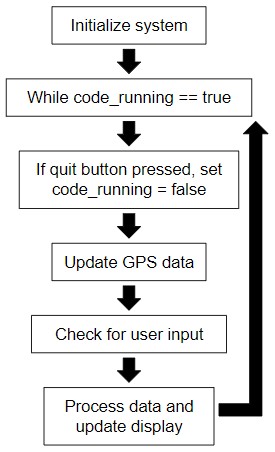
Figure 4: Software overview of the system. After initialization, a while-loop runs repeatedly, responding to user inputs and updates to the GPS data. A physical quit button is also provided to terminate the program.
In the first step shown in Figure 4, the system is initialized. This includes creating constants and global variables, configuring GPIO, initializing the Pygame library [5], loading images, and creating touch buttons. After this step, the program runs in an infinite while-loop. This while-loop can be terminated by pressing a physical quit button; however, this button is primarily for testing purposes. The while-loop starts by updating the data measured by the GPS module. The GPS data refreshes at a rate of one Hz, meaning a new data point is output by the GPS module every second. By refreshing at this rate, the serial connection does not get overwhelmed while still providing timely data updates. This data point includes quantities such as the current latitude, longitude, speed, altitude, and more. Furthermore, it contains the current time and date. Next, the system checks for user inputs and responds to them accordingly. Dep nding on the scenario, the system also will process data and update what is displayed on the screen if necessary. The while-loop then starts again.
We will now discuss the components of the system in more detail. When the system starts up, users are on the home screen as shown in Figure 5.
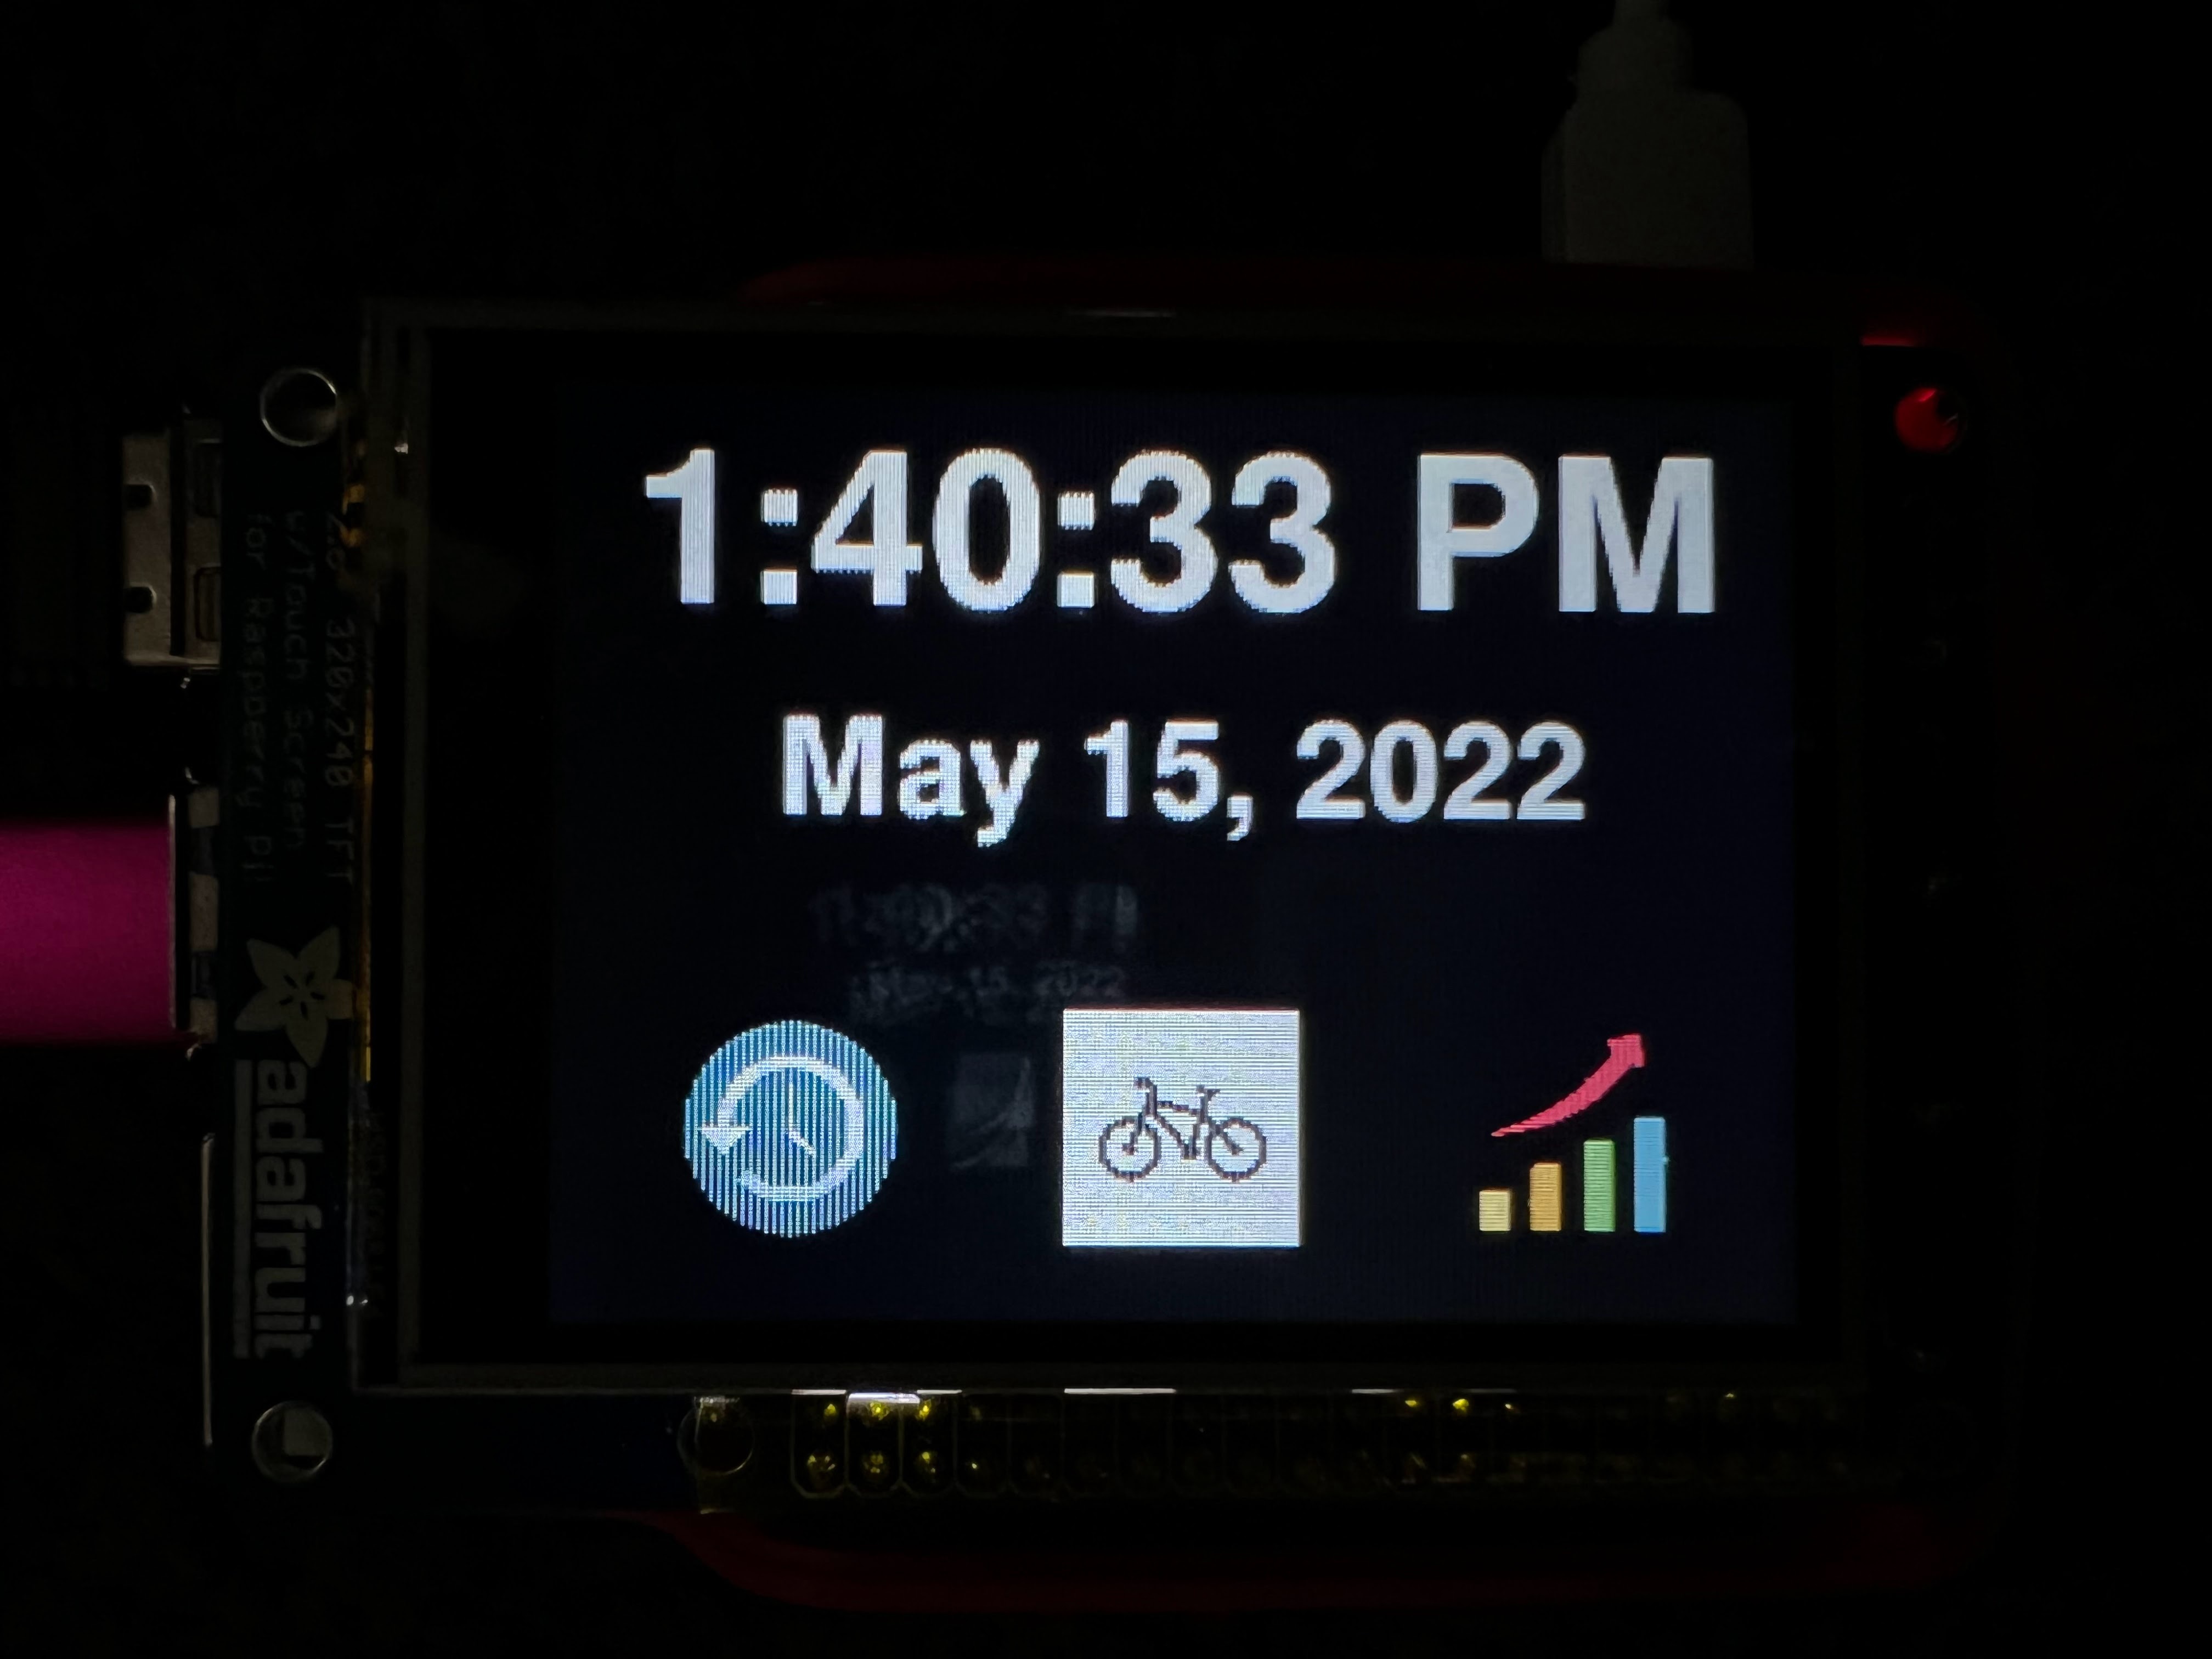
Figure 5: Photograph of the home screen. It displays the current time, current date, and the three menu buttons to access different features of the system.
This screen displays the current time, current date, and three buttons which can be used to access the system’s various functions. The date and time are obtained from the GPS module. Since the GPS module updates every second, the current time data can be displayed to the nearest second just like most digital watches. Since a Raspberry Pi needs an internet connection to accurately determine the date and time on its own, it was very helpful that the GPS module could provide this information. While all outdoor areas have a GPS connection, most outdoor areas do not have internet. The GPS time data had to be processed in two key ways before it could be used. All GPS modules report time in UTC (Coordinated Universal Time), which is five hours ahead of EST. We first had to adjust the hours to match our time zone, EST. Since the GPS measured time in 24-hour format, we could adjust the hours using a simple subtraction. Next, the time had to be processed to match the 12-hour format used in the United States. The 12-hour format is more human readable, and thus a better choice for the home screen. The 24-hour to 12-hour conversion was achieved by adding a few if conditions to determine if the ‘hours’ had to be decremented by 12 and decide whether to display ‘AM’ or ‘PM’. The date, on the other hand, was directly taken from the GPS without any pre-processing.
Finally, the three buttons take the user to three different screens. These buttons, like all buttons in this project, are touch buttons on the PiTFT implemented using Pygame. The first button (from the left) takes the user to the ‘history’ screen, which displays all the activities saved by the user. The second button takes the user to the ‘bike’ screen, which is where the user can save workout sessions and record common statistics, such as total distance traveled, total time elapsed, total elevation gain, and so on. The third button takes the user to the ‘summary’ screen. On this screen, the user can see an accumulation of all stats over a week. Additionally, the user can view graphs that show activity trends on a day-to-day basis for a particular week.
It is important to note that accurate timekeeping as well as datekeeping require an active GPS connection. Without a GPS connection, the code would error out at first. To prevent that from happening, the program displays ‘No GPS’ in place of the time whenever the module does not have a clear and strong GPS signal.
The primary function of our device is to record physical activities. To do so, the ‘bike’ icon is pressed on the home screen, taking the user to the screen below. Again, this is because we designed this project with biking in mind.
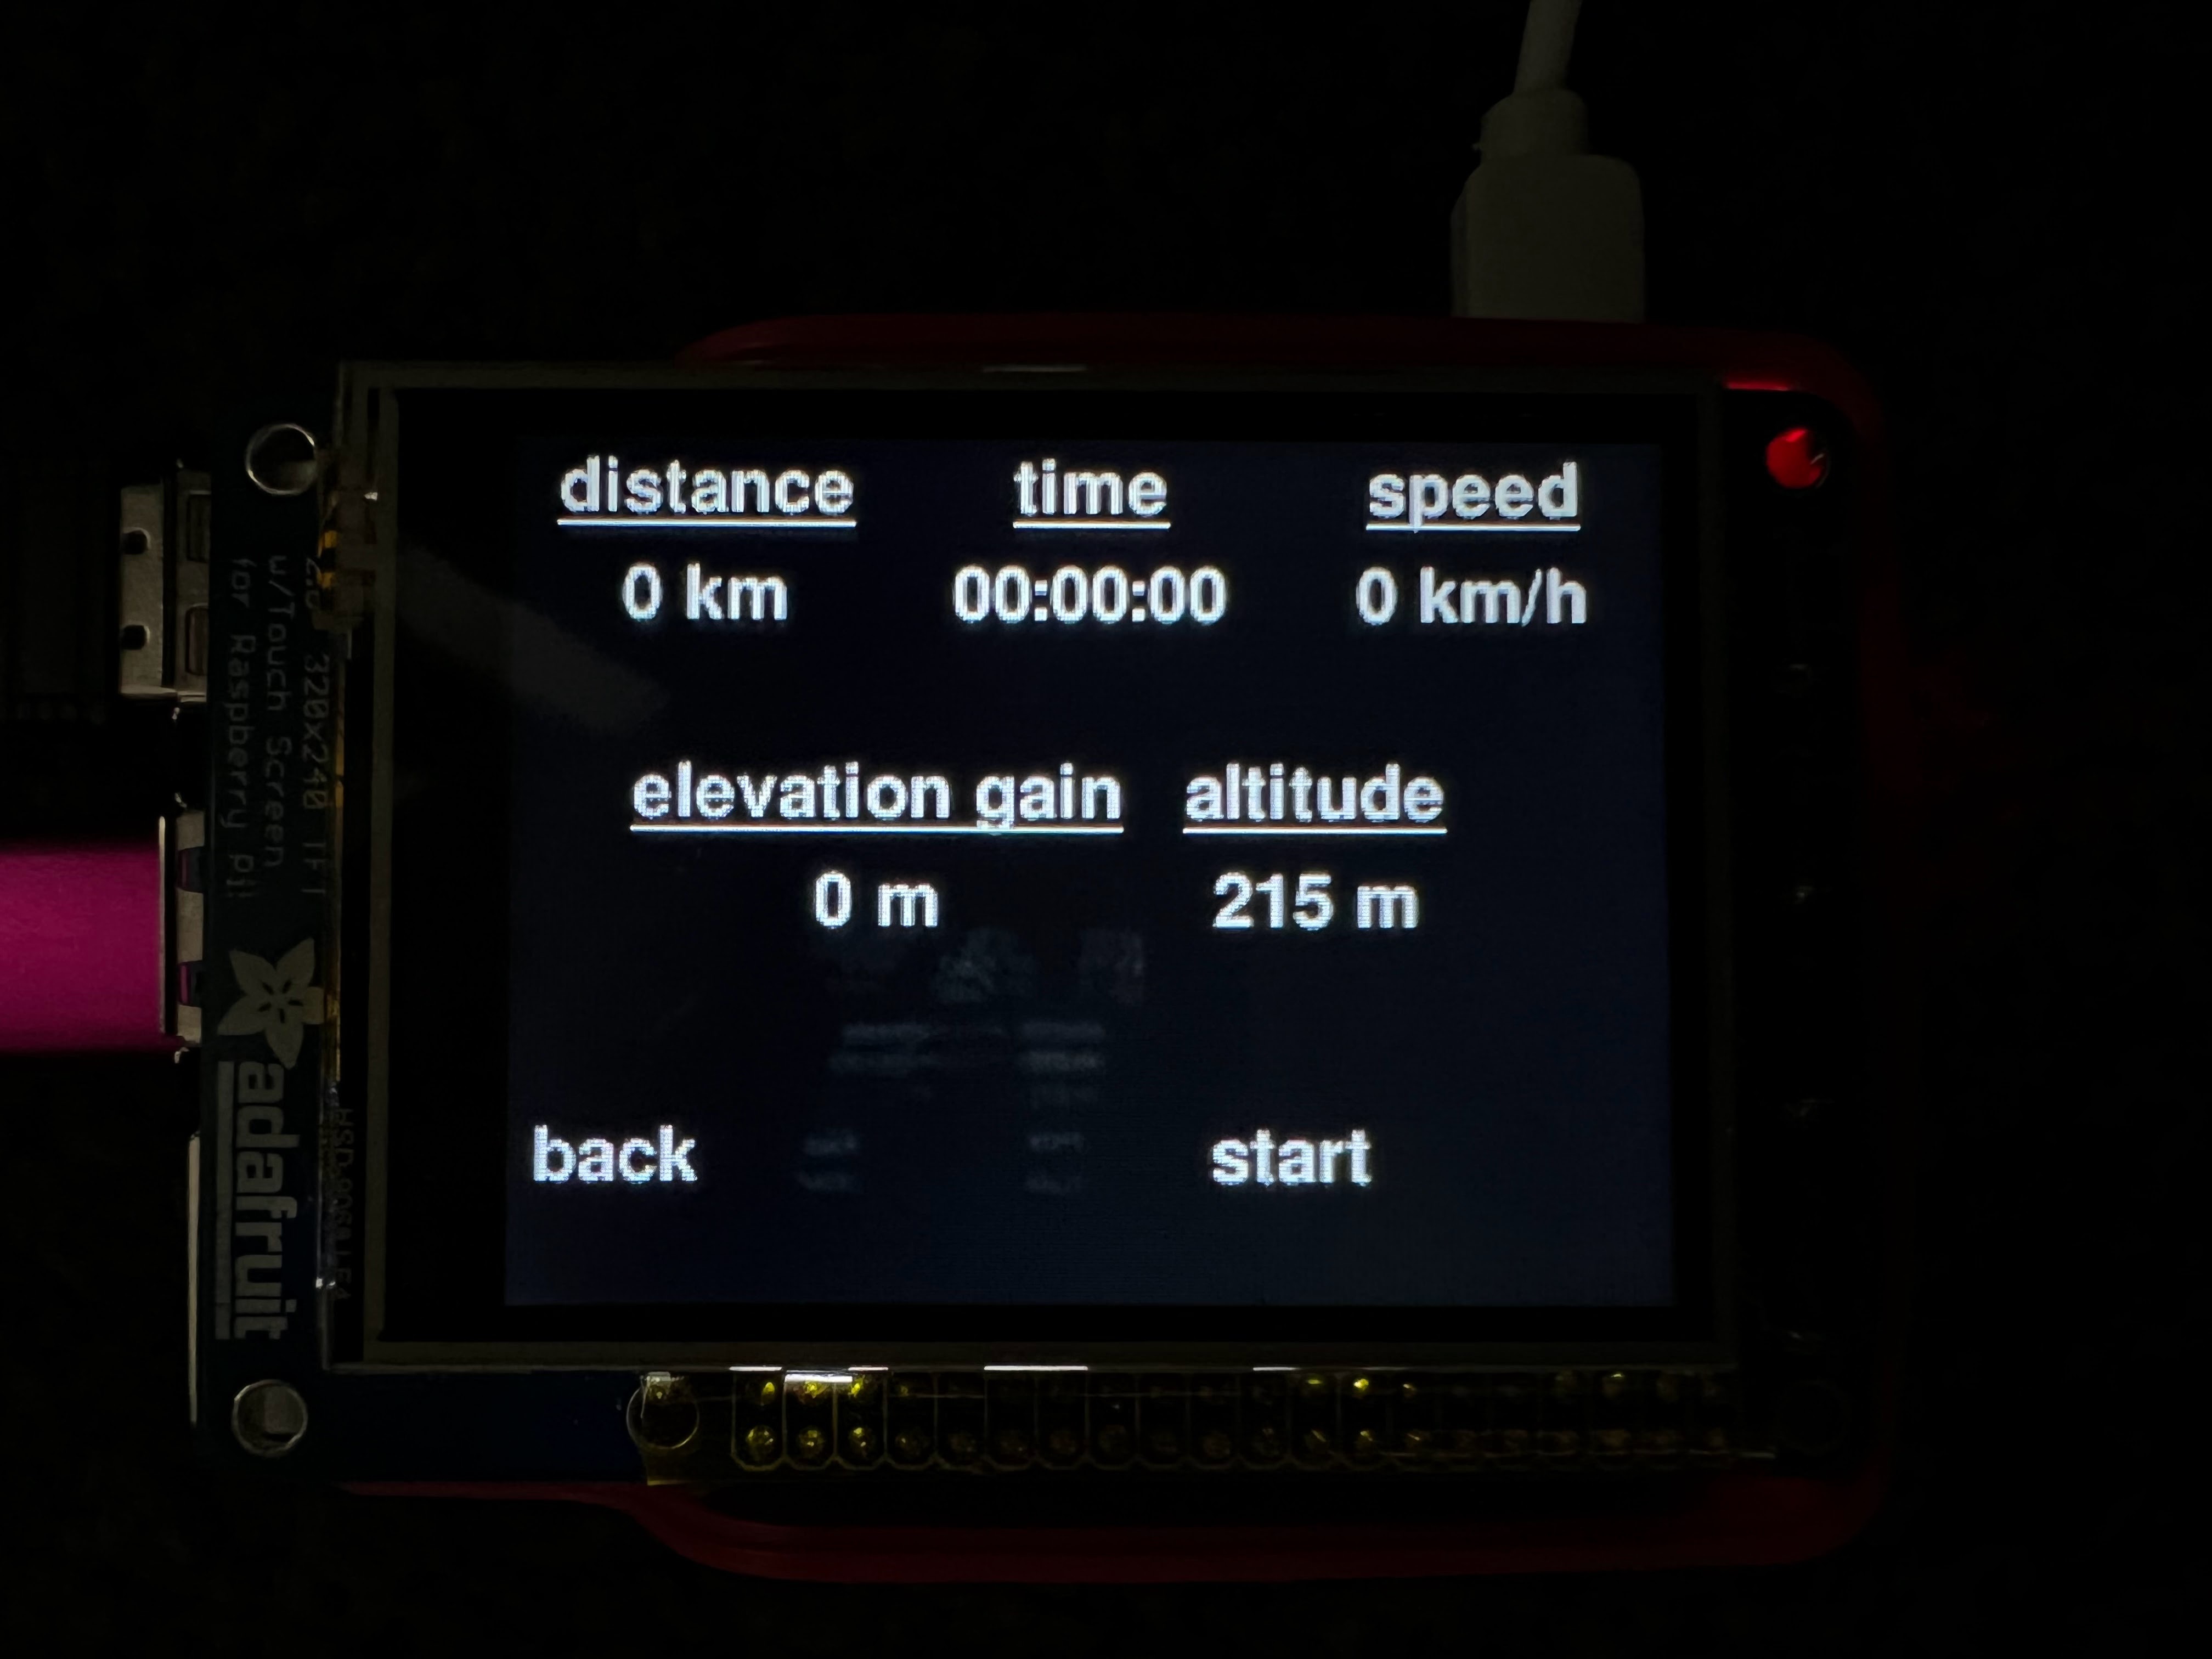
Figure 6: Screenshot of the bike screen before an activity has been started. The “back” button returns to the home screen, and the “start” button starts recording an activity.
The code determines which screen it is on using flags. For example, the “on_bike_screen” flag is set to true when the “bike” button is pressed, and the flags for the other screens are set to false. Figure 6 shows the fields displayed to the user while they complete activities: distance, time, speed, elevation gain, and altitude. Two of the values, speed and altitude, are only based on a current value, whereas distance, time, and elevation gain are cumulative. Therefore, prior to pressing “start”, speed and altitude are displayed immediately while the cumulative values remain at zero. All of the data fields being displayed are stored as global variables in the code. To print this data screen, a function is called which prints all of the variables and their labels in a particular location.
When on this initial bike screen, users may press “back” to return to the home screen. If users want to start recording an activity, they must press “start”. Without GPS, data can not be accurately recorded. Therefore, if there is no GPS connection available, this screen will tell users there is no connection and will not allow them to start recording an activity. If GPS is connected and “start” is pressed, all of the data fields begin showing data.
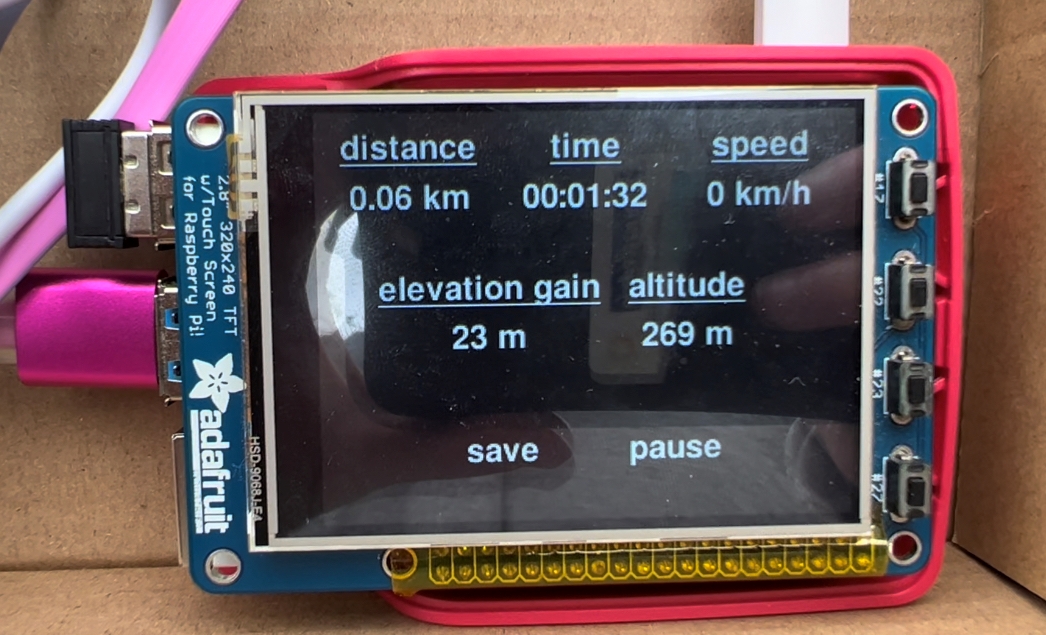
Figure 7: Live photograph taken during the recording of an activity. The “save” button stops recording data and saves the activity, while the “pause” button just stops recording data.
Figure 7 shows what the display looks like while recording an activity. As mentioned, the speed and altitude are live values read from the GPS every second. The altitude is output from the GPS module in meters, our desired unit, so this measured value could be used directly. Speed on the other hand, was provided by the GPS module in units of knots. Speed was thus converted from knots to kilometers per hour by multiplying the knots value by 1.852.
One small issue with the speed and altitude data was that it came in delayed by approximately ten seconds. This was likely due to the low cost of our GPS module, but it would not pose much of an issue with mainstream use cases (such as going for a bike ride, for example).
Computing the other data fields was more complex. We will first describe the elapsed time calculation. When the “start” button is initially pressed, a “reference time” is stored. This is simply the time at which the button was pressed. Every loop iteration, the “current time” is measured, and the elapsed time is calculated as “current time” - “reference time”. We initially believed this was all we had to do, but this logic failed once the pause button was implemented since the time continued incrementing while paused. To solve this problem, we first stopped incrementing the time when the “pause” button was pressed. Then, when the “start” button was pressed to resume, we stored the current value of the elapsed time into a “previous time” variable, and updated “reference time” to be the current time once again. As a result, the formula for elapsed time becomes “current time” - “reference time” + “previous time”, and this worked as desired. One interesting note about this computation is that the measurements were all done in seconds, but the values were displayed in hours, minutes, and seconds. This required various conversions back and forth throughout the code.
Perhaps the most unique computation done was for calculating distance. This was done with the help of the distance function from the GeoPy library which, according to the documentation, computes the “shortest distance on the surface of an ellipsoidal model of the earth” [6]. This is referred to as geodesic distance. The function takes two pairs of latitude and longitude coordinates as an input, and outputs the distance between these pairs of coordinates on the earth’s surface. Our first approach to calculating distance was very simple. Every iteration of the loop, the current values of latitude and longitude were measured and used as one input to the distance function. For the other input, we used the previous latitude and longitude measured to get the distance between the two. Then, this distance was added to an accumulator variable summing all of the distances measured.
This idea was conceptually sound, but it did not work in practice due to the limitations of our GPS module. Because the GPS module is not perfectly accurate, the coordinates measured would slightly change with each measurement. As a result, we were measuring changes in location and ultimately accumulating distance even while standing still. To resolve this issue, we modified our algorithm by adding a threshold. Specifically, we still retrieve the current coordinates with every loop iteration and compute the distance between these coordinates and the previously stored coordinates. However, if the distance is not greater than 50 meters, we simply discard these current coordinates. If the distance is greater than 50 meters, then the accumulated distance is updated, and the current coordinates are stored as the previous coordinates. This concept is shown in Figure 8.
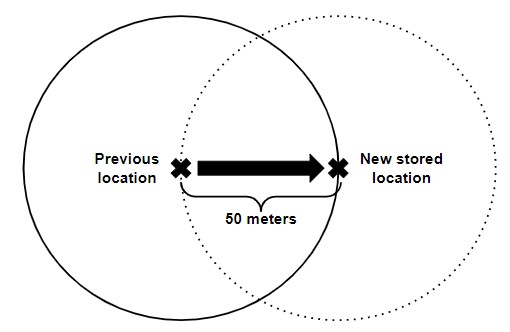
Figure 8: Depiction of the algorithm to compute distance traveled using a threshold. The X on the left is the previous coordinate pair stored. Suppose the user travels to the position marked by the right X. This exceeds the 50 meter threshold marked by the solid circle, so their location gets updated. The new threshold boundary is marked by the dotted circle.
This modification greatly improved our distance calculations. It completely eliminated any false distance accumulation, and led to very accurate distance measurements when traveling in paths with up to moderate turns. With that said, it is not perfect. This is because if the user were to walk around within the threshold boundary, none of this distance would be measured. To increase the accuracy using this algorithm, the threshold would need to be made as small as possible. We may have been able to shrink our threshold with additional experimentation, but a more expensive (and hence accurate) GPS module certainly would have helped as well.
Another challenge faced was factoring in elevation gain. An approximation of the problem is illustrated in Figure 9.
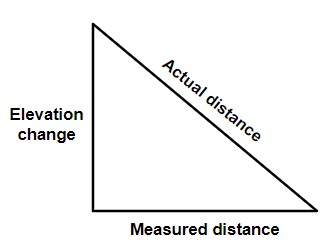
Figure 9: Illustration of the error in distance caused by elevation changes. The distance function used does not factor in changes in elevation, meaning it ignores the vertical component of distance traveled.
Because the Geopy distance function approximates the earth as a perfect ellipsoid, it does not capture any changes in elevation information. On a small scale, it essentially looks as if the user is traveling across perfectly flat land. This error could be corrected with the Pythagorean theorem to include the measured elevation change, however, this is complicated by the fact that earth’s surface is not flat on average. We ultimately used the assumption that the earth is a perfect ellipsoid for this project, because the measurements were still quite accurate for our purposes. With more time, we would have investigated more sophisticated ways to modify our algorithm.
The calculation for elevation gain was similar to, but simpler than, the one for distance. Each loop iteration, the current altitude was measured and compared to the previously stored altitude. A threshold was again used to prevent jitter from being interpreted as elevation changes. We found that a threshold of three meters worked well for this. Note that for elevation gain, we only accumulated positive changes in elevation gain. This is because during physical activities, users may be interested in specifically seeing how many meters uphill they have traveled. Although this elevation gain algorithm could not be improved much, we were again limited by the accuracy of the GPS module itself. We found that it definitely does detect uphills and downhills, but their magnitudes often seemed several meters off.
Similar to accumulating elapsed time, we had to account for the paused state while accumulating distance and elevation gain. To do so, we stopped updating distance and elevation while paused. Once resuming the activity, previous coordinates and altitude were set to the current coordinates and altitude, respectively. This essentially changes the user’s initial point of reference to wherever they may be when they resume their activity.
We conducted numerous tests to verify the operation of our activity recording. We started by going on walks up to 600 meters long. Once we were confident in our calculations, we conducted numerous tests by driving in a car with our system. During these tests, we used a Garmin GPS running watch as a reference for our distance and elevation gain. We found that the speed measured was almost perfectly accurate, as was the distance traveled when moving in a straight line. The elevation gain was accurate enough to be useful but certainly showed some error. For example, on a hill 23 meters tall, our system measured a change of approximately 18 meters. Perhaps most importantly, our distance calculations remained fairly accurate during a drive with a fair amount of turning. We drove for around eight minutes, with two to three minutes through grid-like city streets. At the end of the test, our distance was off by around 300 meters. While not perfect, we were impressed by the accuracy of our system considering its limitations.
To finish recording an activity, the “save” button is pressed. Doing so writes the data to a file, as will be described shortly. A software diagram summarizing the operation of recording activities is in Figure 10.
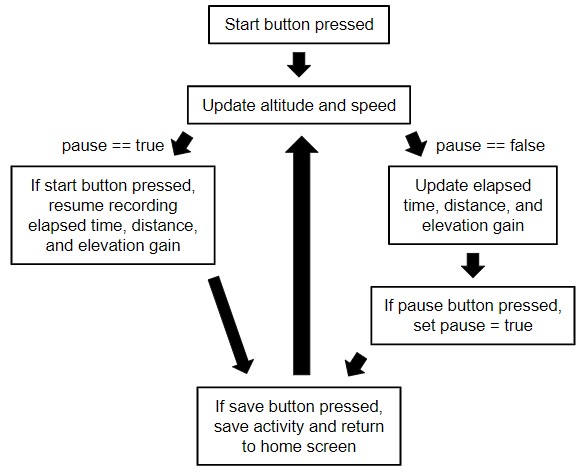
Figure 10: Software flowchart for recording activities. Live altitude and speed are always displayed. When paused, users can either save the activity or resume recording. When not paused, distance, time, and elevation are accumulated. Users can pause or save the activity at this time.
Our system is not just designed to record activities; it is also meant to allow users to view their past activities. This leads us to the other two buttons on the home screen. The leftmost button is the “history” button. Pressing this button allows users to view all of the past activities they have recorded. Figure 11 shows a sample activity.
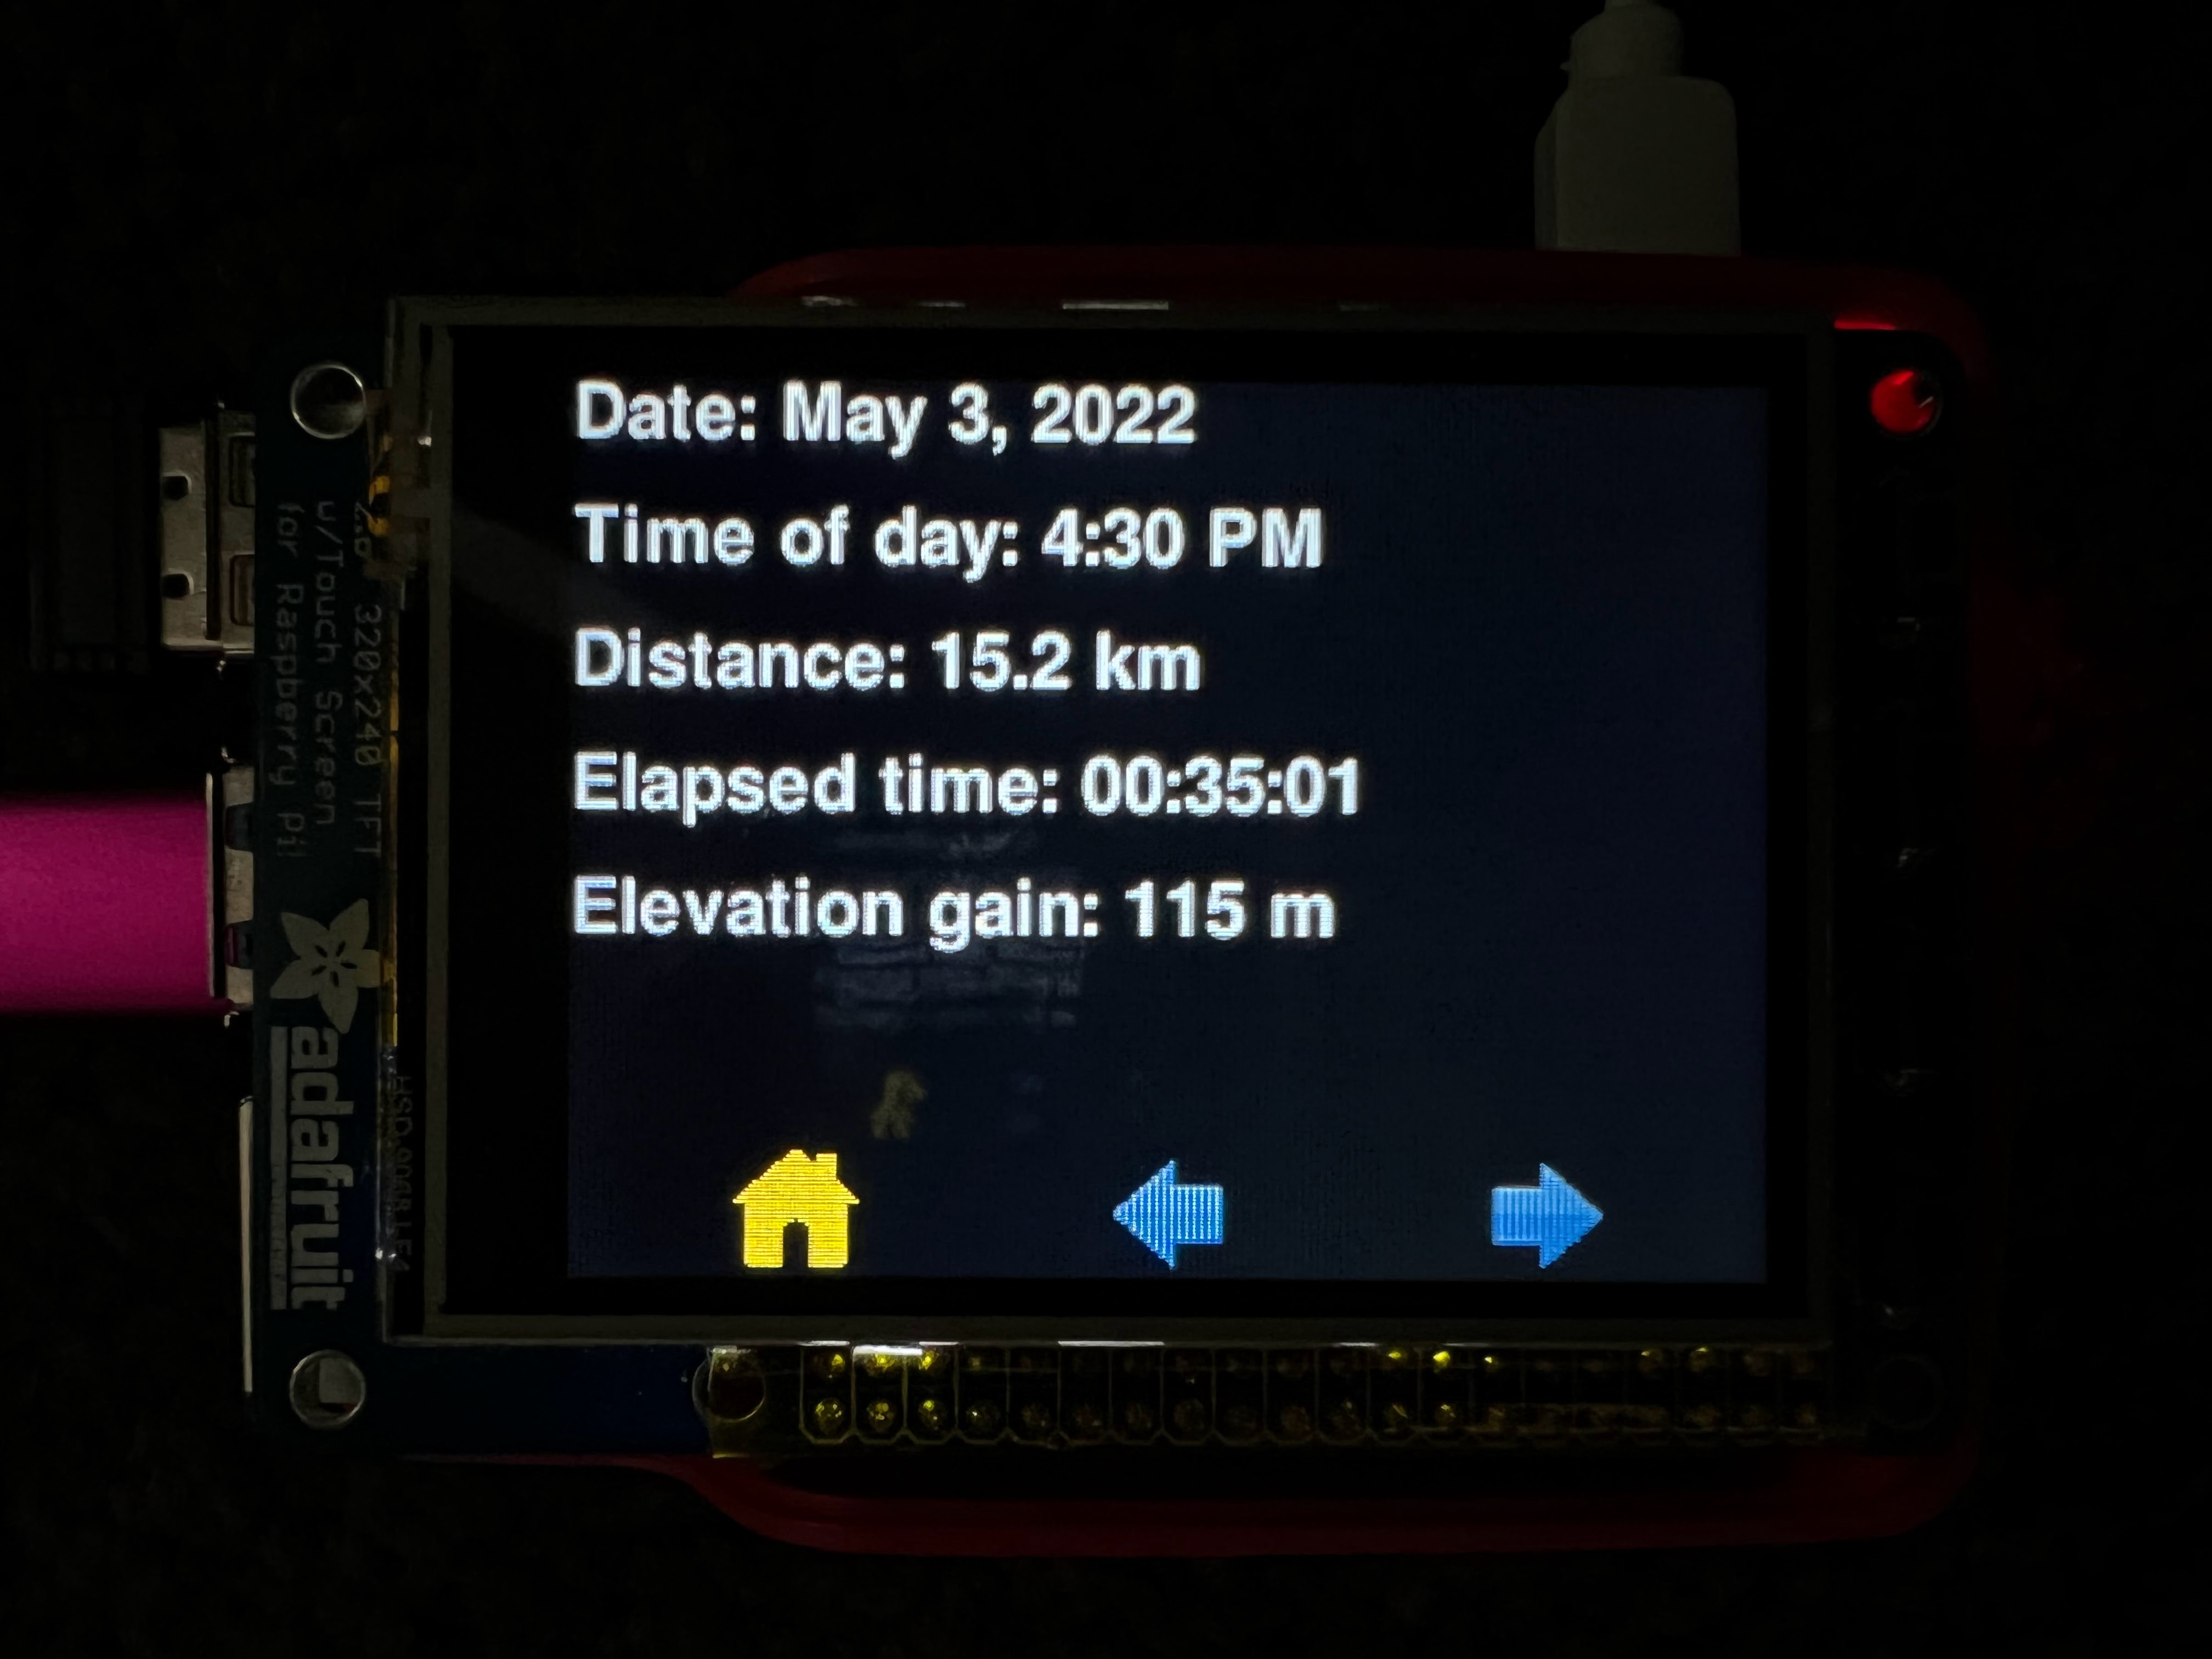
Figure 11: Sample activity in the history screen. Pressing the home button returns to the home screen. The left and right arrows can be used to view less recent and more recent activities, respectively.
The majority of this feature’s implementation actually occurs when the “save” button is pressed. When this happens, a function is called to write the current activity being recorded to a file. A .txt file is written to a filesystem folder called “activities”. The name of the file is the current date followed by the current time in 24-hour format. The current values of the global variables for the date, time of day, distance, elapsed time, and elevation gain are used when writing this file. The file looks exactly like the text in Figure 11; this made displaying the file later easy.
This file structure was crucial when implementing the history functionality. First, we read the names of the files in the “activities” directory. Due to the naming scheme for the activity files, this list of activities automatically has the activities in chronological order. The activity being displayed is selected by maintaining an index into this activities list. In each loop iteration, the index is used to retrieve one activity file name from the list. The contents of this activity file are then displayed. When an arrow button is pressed, the index is incremented or decremented accordingly to display a different activity.
We faced two bugs while implementing this feature. First, our activities were not completely chronological initially, because we were not using double-digit dates. For example, May 2 and May 10 were represented as 5/2 and 5/10 rather than 05/02 and 05/10. The first naming scheme’s alphabetical ordering did not result in a chronological ordering, whereas the second naming scheme does. The 24-hour naming scheme was also required instead of a 12-hour naming scheme for similar reasons. The second bug was that the history screen would crash when no activities were stored yet. Thus, we only try to read files from the “activities” directory if there in fact exists files in the directory.
Fitness trackers, however, should not just let you save your sessions and view your past activities. They should also allow you to view and assess your progress in a meaningful way. Our system achieves this by processing the data collected in the ‘activities’ folder in two key ways. Firstly, the system reads all the data stored in the ‘activities’ files, and stores and displays weekly totals of distance, elapsed time, and elevation gain. These weekly summaries can be accessed by clicking the rightmost button on the home screen which takes the user to the ‘summary’ screen. The summary screen is shown in Figure 12.
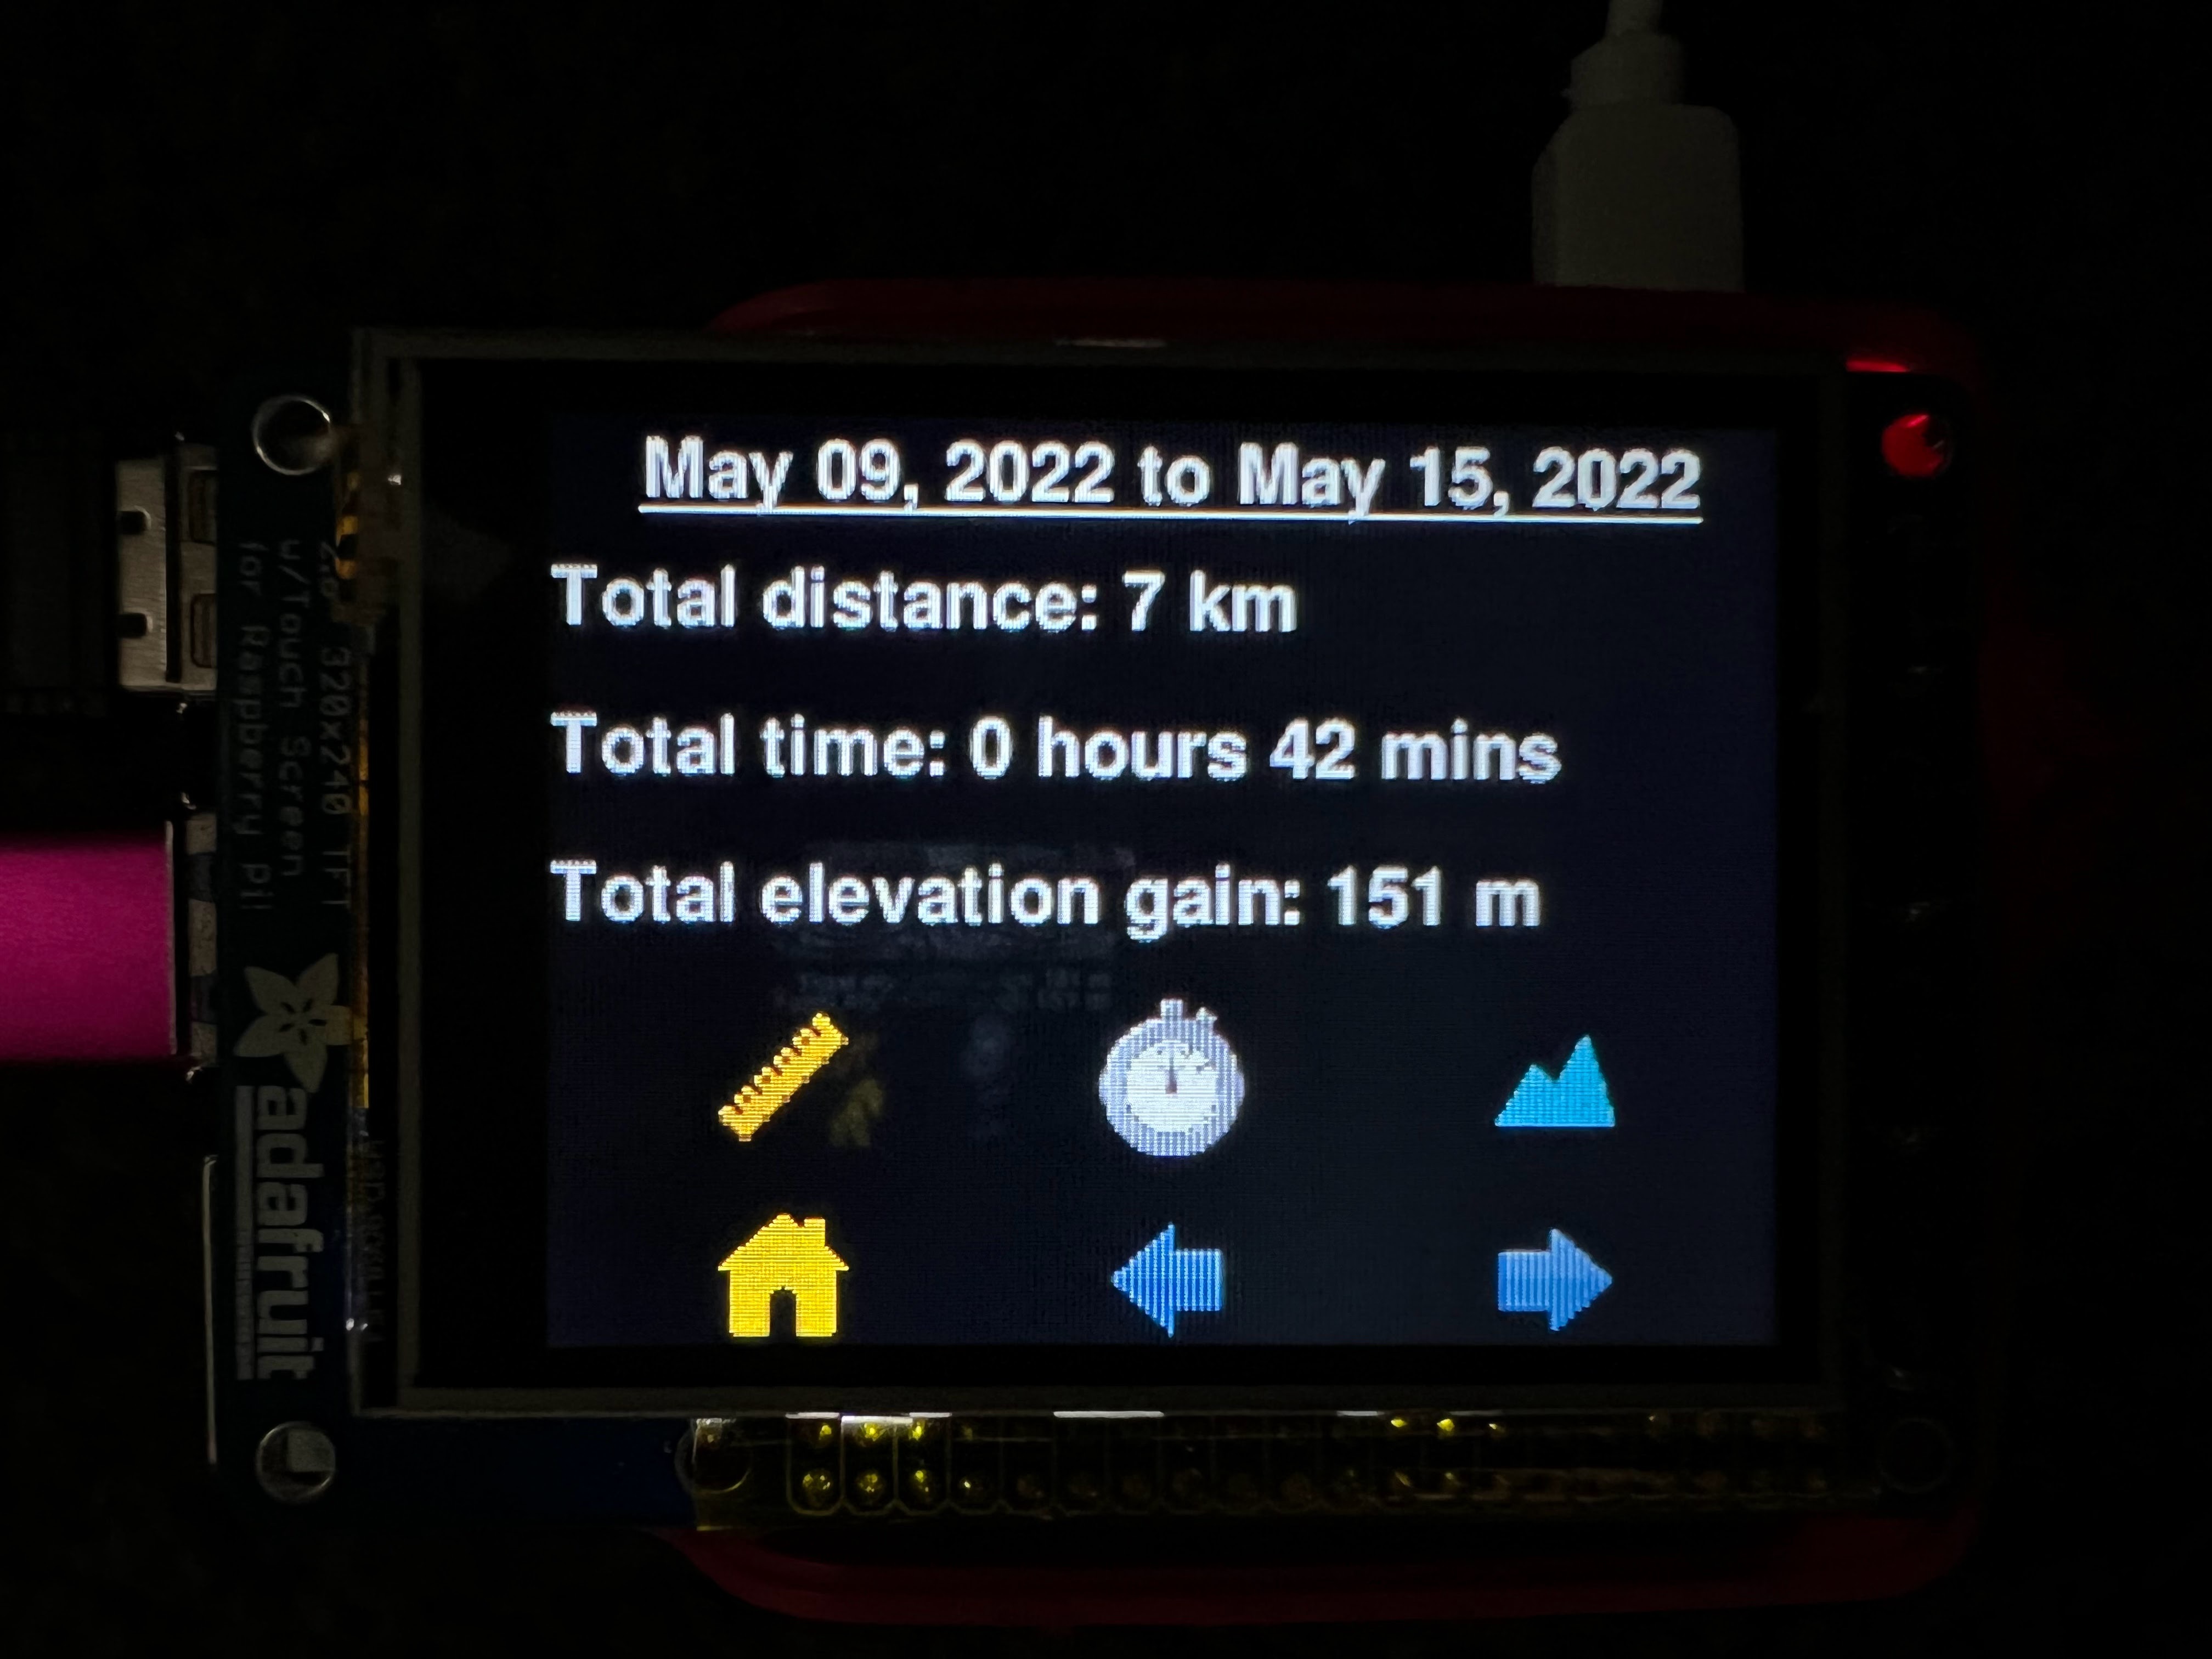
Figure 12: Sample summary screen, showing the total distance, total time, and total elevation gain of the week May 09 to May 15, 2022.
As demonstrated in Figure 12, the ‘summary’ screen displays the starting date of the week, as well as the ending date of the week at the top of the screen. It then displays the ‘Total distance’ traveled within the week, ‘Total time’ spent exercising during the week, and the ‘Total elevation gain’. The distance is displayed in ‘km’, the total time in hours and minutes, and the total elevation gain in ‘m’. These units were chosen because it is highly unlikely that the user would travel less than a ‘km’ throughout a week, or exercise for less than a minute. Thus, it was not necessary to increase the resolution of these particular statistics.
The arrow keys can be used to browse through the weeks. Their implementation on this screen is identical to their implementation on the ‘history’ screen: left arrow for an earlier week, and the right arrow for a later week (unless the weeks need to be ‘wrapped’ around, in which case, they switch). The ‘home’ button, again, takes the user to the ‘home’ screen.
Secondly, the system plots the weekly data to produce distance, time, and elevation gain graphs. The resulting graphs are bar plots that show how the statistics vary over the course of the week, from Monday to Sunday. The x-axis of the graphs shows the day of the week, and the y-axis shows the particular statistic in question. The ‘graphs’ screen can be accessed by clicking the three buttons placed above the navigation buttons. The leftmost button can be clicked to access the distance graph corresponding to the week currently being displayed on the summary screen. The middle button can be clicked to access the time graph, and the rightmost button can be clicked to access the elevation gain graph. Moreover, the arrow keys can be used with the graphs as well. Once on the ‘graphs’ screen, the arrow keys can cycle through the graphs of different weeks. Figure 13 shows examples of all three graphs.
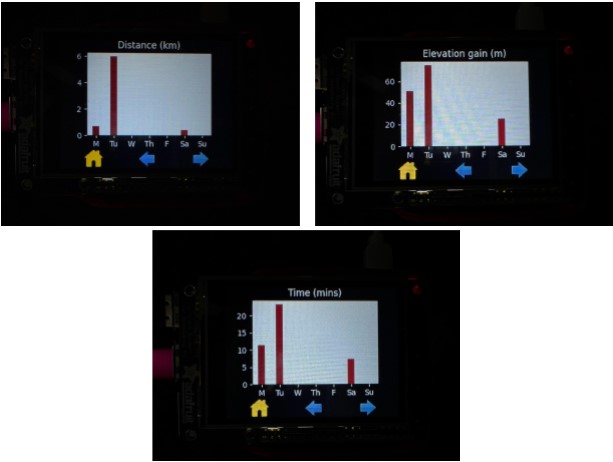
Figure 13: Example distance, time, and elevation gain graphs corresponding to the week May 09 to May 15, 2022.
We used helper functions to achieve the processing highlighted above. Figure 14 below shows a flowchart of the additional tasks the system performs every time a user hits the ‘save’ button.
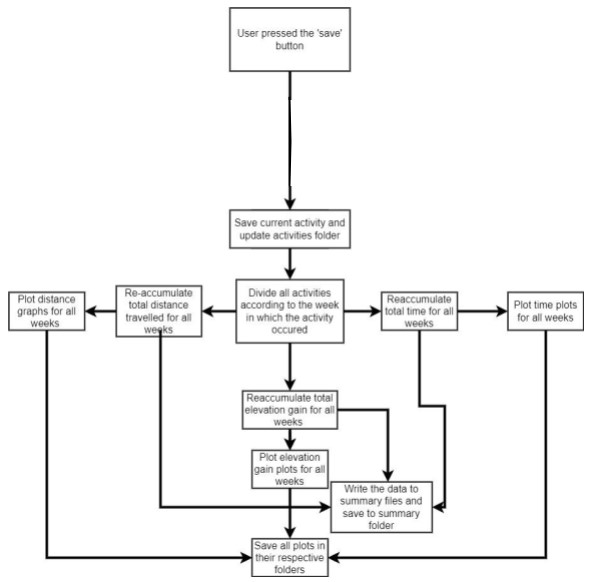
Figure 14: Software flow diagram depicting what occurs when the save button is pressed. First, a file is made for the current activity. Then, weekly data across all activities is recomputed. This data is saved in two forms: .txt files containing weekly totals, and .jpg files containing graph plot images.
In addition to the tasks described in the ‘history’ screen section, hitting the ‘save’ button initiates the summary calculation and writing process. Once the activities folder has been updated, the system starts reading from the most recent activity file, and uses the date in its file name to calculate on which day of the week the activity took place. The system does this by using the DateTime module, which contains useful helper methods that enable easy and efficient date-related calculations. Then, the system calculates what date would correspond to the start of that particular week (i.e., a Monday), and what date would correspond to the end of that week (i.e., a Sunday). These dates are stored as the start_date and the end_date. For every subsequent activity file that is read, the system checks whether the activity falls in the same week as the previous activity. If it does, the distance, time, and elevation gain measurements from the current activity are accumulated into their respective accumulators. Once all the activities belonging to a week have been processed, the total distance, total elapsed time, and total elevation gain are written to a ‘summary’ file. This summary file is stored in the ‘summaries’ folder, distinct from the ‘activities’ folder. The start_date is used as the file name to keep things alphabetical and hence chronological as well.
In addition to the summary writing process, the system keeps track of daily measurements as well. While reading the activity files, it adds up all the session statistics corresponding to a particular day. Hence, there are two accumulations occurring simultaneously: one for the weekly totals, and one for each day during that week. The daily accumulations are used to create the graphs. We use Matplotlib to generate all our graphs. Instead of keeping the plots open at all times, we decided to maintain three folders for our plots, one for each measurement. Once the graphs have been generated, we first save the plots in their respective folders, and then immediately close the plots. This was done to ensure that the system never gets overloaded. Matplotlib plots consume a significant amount of RAM when open. During our initial runs, we ran into issues wherein Matplotlib complained about shortage of RAM. Moreover, the system had gotten noticeably slower. Saving the plots as images, and then simply loading the image when the user requested a particular plot, saved a lot of memory and was not very challenging to implement, especially since we had all the file management code ready. We simply re-used the activity loading and saving code to load and save plots.
Accumulating and plotting the data went smoothly overall. A bulk of the issues we faced with the plots stemmed from formatting. The plots were simply too big for the small PiTFT screen. Resizing the plots did not do much, since the axes labels became unreadable. In addition, the white space around the plot did not blend well with the black background. The plots looked awkward and unnatural. To solve these issues, we had to search for the specific method calls and attribute settings that could allow us to alter these parameters. We changed the whitespace around the plot area to ‘black’-space, which allowed the plot to blend in with the background. We also had to change the font color from black to white. Additionally, we found a parameter that allowed us to change the axes labels font size. We could then make the axes labels bigger without making the plots too big for the screen. These changes, along with a few more minor changes, made the plots look better on the small PiTFT screen.
Results
Overall, everything in our project performed as planned and we met the goals outlined in our project proposal. Our ultimate goal was to create an affordable fitness tracker that could reasonably calculate key metrics provided by more expensive, mainstream fitness trackers. We also wanted to implement a system that could effectively store and summarize user data. We certainly accomplished this goal. All of the metrics mentioned can be calculated by our system with a reasonable amount of accuracy. The data for these activities can be viewed in an intuitive and useful way, and the weekly summaries and graphs provide a meaningful analysis of this data. Furthermore, our system operates smoothly and without any bugs.
Perhaps most importantly, our system would be practical to use in serious applications. The user interface is easy to use and “just works”. With more compact packaging, we feel that this device could be put to real use.
Conclusions
This project is ultimately a proof of concept that a useful fitness tracker does not need to cost hundreds of dollars. It also is a testament to how capable a system as simple as the Raspberry Pi can be. With additional time and refinement, it seems plausible that this system could serve as a genuine daily fitness tracker. Perhaps the code could be made open-source, allowing anyone who purchases the parts to create this device for themselves.
We did not necessarily discover anything that definitely did not work while doing this project. However, we did discover some design considerations that must be made while designing a system like this. First, the screen must be large enough. We considered using a smaller screen and immediately could see how this would make designing a usable interface more challenging. Second, the system must remain portable. Our system was fine for our purposes, but in real use we would certainly need to get a smaller battery pack, fasten the GPS more securely, and enclose everything. Striking a balance between this usability and portability is key, and veering too far in either direction will certainly result in a system that is not practical.
Future Work
With additional time, we primarily would have worked on improving our algorithm for calculating distance. Perhaps we could devise a way to factor elevation changes into the calculation. We also could have tried shrinking the distance threshold further by doing more experiments, allowing sharper turns to be measured more accurately. One possible stretch goal would be to allow users to upload their activity’s route to a computer as is done with some popular fitness trackers. By doing so, map data could be used to accurately factor elevation changes into the distance calculation.
We also could spend time making the system more compact, as described above. We could have also continued implementing more features such as customizable data fields and layouts, more summary statistics, a compass, and more. Another interesting possibility if this project were to be open source is that anyone wanting a new feature on this device could add it if they knew how to do so.
Budget
- Raspberry Pi 4 $35 (given to us in lab)
- Adafruit Ultimate GPS module $30
- PiTFT [8] $20 (given to us in lab)
Total: $85
References
[1] J. Skovira. “Setting up an SD card on a Mac.” ECE 5725 Canvas Website. (accessed Mar. 9, 2022)
[2] J. Skovira. “ECE 5725: Lab 1.” ECE 5725 Canvas Website. (accessed Mar. 9, 2022)
[3] “Adafruit Ultimate GPS Breakout - 66 channel w/ 10 Hz updates - PA1616S.” Adafruit. https://www.adafruit.com/product/746#technical-details (accessed Apr. 15, 2022)
[4] “CircuitPython & Python Setup.” Adafruit. https://learn.adafruit.com/adafruit-ultimate-gps/circuitpython-parsing (accessed Apr. 15, 2022)
[5] “Pygame Documentation.” Pygame. https://www.pygame.org/docs/ (accessed May 3, 2022)
[6] “Welcome to GeoPy’s documentation!” GeoPy. https://geopy.readthedocs.io/en/stable/#module-geopy.distance (accessed May 3, 2022)
[7] “Raspberry Pi 4 Model B.” Raspberry Pi. https://datasheets.raspberrypi.com/rpi4/raspberry-pi-4-datasheet.pdf (accessed May 3, 2022)
[8] “MI0283QT-11 Specification Datasheet by Adafruit Industries LLC.” Digi-Key Electronics. https://www.digikey.com/htmldatasheets/production/1640715/0/0/1/mi0283qt-11-specification.html (accessed May 3, 2022)
Code Appendix
1 2 3 4 5 6 7 8 9 10 11 12 13 14 15 16 17 18 19 20 21 22 23 24 25 26 27 28 29 30 31 32 33 34 35 36 37 38 39 40 41 42 43 44 45 46 47 48 49 50 51 52 53 54 55 56 57 58 59 60 61 62 63 64 65 66 67 68 69 70 71 72 73 74 75 76 77 78 79 80 81 82 83 84 85 86 87 88 89 90 91 92 93 94 95 96 97 98 99 100 101 102 103 104 105 106 107 108 109 110 111 112 113 114 115 116 117 118 119 120 121 122 123 124 125 126 127 128 129 130 131 132 133 134 135 136 137 138 139 140 141 142 143 144 145 146 147 148 149 150 151 152 153 154 155 156 157 158 159 160 161 162 163 164 165 166 167 168 169 170 171 172 173 174 175 176 177 178 179 180 181 182 183 184 185 186 187 188 189 190 191 192 193 194 195 196 197 198 199 200 201 202 203 204 205 206 207 208 209 210 211 212 213 214 215 216 217 218 219 220 221 222 223 224 225 226 227 228 229 230 231 232 233 234 235 236 237 238 239 240 241 242 243 244 245 246 247 248 249 250 251 252 253 254 255 256 257 258 259 260 261 262 263 264 265 266 267 268 269 270 271 272 273 274 275 276 277 278 279 280 281 282 283 284 285 286 287 288 289 290 291 292 293 294 295 296 297 298 299 300 301 302 303 304 305 306 307 308 309 310 311 312 313 314 315 316 317 318 319 320 321 322 323 324 325 326 327 328 329 330 331 332 333 334 335 336 337 338 339 340 341 342 343 344 345 346 347 348 349 350 351 352 353 354 355 356 357 358 359 360 361 362 363 364 365 366 367 368 369 370 371 372 373 374 375 376 377 378 379 380 381 382 383 384 385 386 387 388 389 390 391 392 393 394 395 396 397 398 399 400 401 402 403 404 405 406 407 408 409 410 411 412 413 414 415 416 417 418 419 420 421 422 423 424 425 426 427 428 429 430 431 432 433 434 435 436 437 438 439 440 441 442 443 444 445 446 447 448 449 450 451 452 453 454 455 456 457 458 459 460 461 462 463 464 465 466 467 468 469 470 471 472 473 474 475 476 477 478 479 480 481 482 483 484 485 486 487 488 489 490 491 492 493 494 495 496 497 498 499 500 501 502 503 504 505 506 507 508 509 510 511 512 513 514 515 516 517 518 519 520 521 522 523 524 525 526 527 528 529 530 531 532 533 534 535 536 537 538 539 540 541 542 543 544 545 546 547 548 549 550 551 552 553 554 555 556 557 558 559 560 561 562 563 564 565 566 567 568 569 570 571 572 573 574 575 576 577 578 579 580 581 582 583 584 585 586 587 588 589 590 591 592 593 594 595 596 597 598 599 600 601 602 603 604 605 606 607 608 609 610 611 612 613 614 615 616 617 618 619 620 621 622 623 624 625 626 627 628 629 630 631 632 633 634 635 636 637 638 639 640 641 642 643 644 645 646 647 648 649 650 651 652 653 654 655 656 657 658 659 660 661 662 663 664 665 666 667 668 669 670 671 672 673 674 675 676 677 678 679 680 681 682 683 684 685 686 687 688 689 690 691 692 693 694 695 696 697 698 699 700 |
# By Morgan Cupp (mmc274) and Maanav Shah (mcs356) # ECE 5725 Final Project: Fitness Tracker # Completed: May 9, 2022 import time import RPi.GPIO as GPIO import pygame from pygame.locals import * import os import adafruit_gps import serial from geopy import distance import datetime import matplotlib import matplotlib.pyplot as plt import numpy as np # configure GPIO GPIO.setmode(GPIO.BCM) # set broadcom GPIO.setup(27, GPIO.IN, pull_up_down=GPIO.PUD_UP) # quit button # piTFT setup os.putenv('SDL_VIDEODRIVER', 'fbcon') # display on piTFT os.putenv('SDL_FBDEV', '/dev/fb0') # use this when HDMI is not plugged in os.putenv('SDL_MOUSEDRV', 'TSLIB') # track mouse clicks on piTFT os.putenv('SDL_MOUSEDEV', '/dev/input/touchscreen') pygame.init() # initialize pygame # set up GPS module uart = serial.Serial('/dev/ttyUSB0', baudrate=9600, timeout=10) # set up serial to GPS module gps = adafruit_gps.GPS(uart, debug=False) # create GPS module instance gps.send_command(b'PMTK314,0,1,0,1,0,0,0,0,0,0,0,0,0,0,0,0,0,0,0') # enable GGA and RMC info gps.send_command(b'PMTK220,1000') # update GPS once per second # pygame configuration pygame.mouse.set_visible(False) # false when running on piTFT screen = pygame.display.set_mode((320,240)) # display size large_font = pygame.font.Font(None, 80) # large font size medium_font = pygame.font.Font(None, 50) # medium font size small_font = pygame.font.Font(None, 30) # small font size home_button_size = 60, 60 button_size = 40,40 # RGB color representations WHITE = 255, 255, 255 BLACK = 0,0,0 RED = 255, 0, 0 GREEN = 0, 255, 0 # global variables last_time = time.monotonic() # last time gps was updated labels = {'distance': (53,15), 'time': (159,15), 'speed': (265,15), # labels for data fields 'elevation gain': (100,100), 'altitude': (221,100)} altitude = 0 # current altitude elevation_gain = 0 # total elevation gain during an activity first_val_alt = True # true when no altitude values have been measured yet prev_altitude = 0 # previous altitude measured speed = 0 # current speed dist = 0 # accumulator used for distance travelled prev_latitude = 0 # previous latitude measured prev_longitude = 0 # previous longitude measured first_val = True # true when no distance values have been measured yet ref_time = 0 # reference time being used to measure activity duration elapsed_time = '00:00:00' # elapsed time of the user's current activity prev_time = 0 # previous time measured screen_num = 0 # index of the screen being displayed (when using arrow buttons) activities = [] # list of names of all activity files summaries = [] # list of names of all activity summmary files graphs = [] # list of names of all activity summmary files graph_path = '' # path to the name of a particular graph file # flags code_running = True # run code while this is true on_home_screen = True # true when when user is on the home screen on_bike_screen = False # true when user is on bike screen on_history_screen = False # true when user is on history screen on_summary_screen = False # true when user is on summary screen on_graph_screen = False # true when user is on graph screen start = False # true when an activity has been started pause = False # true when an activity is paused screen.fill(BLACK) # erase workspace # load images bike = pygame.image.load('/home/pi/final_project/images/bike.jpg') bike = pygame.transform.scale(bike, home_button_size) history = pygame.image.load('/home/pi/final_project/images/history.png') history = pygame.transform.scale(history, home_button_size) left_arrow = pygame.image.load('/home/pi/final_project/images/left_arrow.png') left_arrow = pygame.transform.scale(left_arrow, button_size) right_arrow = pygame.image.load('/home/pi/final_project/images/right_arrow.png') right_arrow = pygame.transform.scale(right_arrow, button_size) home = pygame.image.load('/home/pi/final_project/images/home.png') home = pygame.transform.scale(home, button_size) summary = pygame.image.load('/home/pi/final_project/images/summary.png') summary = pygame.transform.scale(summary, home_button_size) dist_graph = pygame.image.load('/home/pi/final_project/images/distance.png') dist_graph = pygame.transform.scale(dist_graph, button_size) time_graph = pygame.image.load('/home/pi/final_project/images/time.png') time_graph = pygame.transform.scale(time_graph, button_size) elev_graph = pygame.image.load('/home/pi/final_project/images/elevation.png') elev_graph = pygame.transform.scale(elev_graph, button_size) # create home screen buttons home_screen_buttons = {history: (60,190), bike: (160,190), summary: (260,190)} home_screen_button_rects = {} for image, position in home_screen_buttons.items(): rect = image.get_rect(center=position) home_screen_button_rects[image] = rect # create bike screen buttons bike_screen_buttons = {'save': (107,200), 'start': (214,200), 'pause': (214,200), 'back': (30,200)} bike_screen_button_rects = {} for text, position in bike_screen_buttons.items(): text_surface = small_font.render(text, True, WHITE) rect = text_surface.get_rect(center=position) bike_screen_button_rects[text] = rect # create arrow buttons arrow_buttons = {home: (60,220), left_arrow: (160,220), right_arrow: (260,220)} arrow_button_rects = {} for image, position in arrow_buttons.items(): rect = image.get_rect(center=position) arrow_button_rects[image] = rect # create graph selection buttons graph_selection_buttons = {dist_graph: (60,170), time_graph: (160,170), elev_graph: (260,170)} graph_selection_button_rects = {} for image, position in graph_selection_buttons.items(): rect = image.get_rect(center=position) graph_selection_button_rects[image] = rect # display the time of day on the home screen def display_time_of_day(): global time_of_day if not gps.has_fix: # if GPS not connected, can't tell the time time_of_day = 'NO GPS' else: time_of_day = '{:02}:{:02}:{:02}'.format( # get UTC time from gps gps.timestamp_utc.tm_hour, gps.timestamp_utc.tm_min, gps.timestamp_utc.tm_sec, ) hour = (int(time_of_day[:2])-4)%24 # convert UTC time to EST if (hour < 12): # convert 24-hour EST time to AM/PM am_pm = 'AM' elif (hour == 12): am_pm = 'PM' else: am_pm = 'PM' hour = hour-12 time_of_day = str(hour) + time_of_day[2:] + ' ' + am_pm text_surface = large_font.render(time_of_day, True, WHITE) rect = text_surface.get_rect(center=(160,40)) screen.blit(text_surface, rect) # display the date on the home screen def display_date(): global date if not gps.has_fix: # if GPS not connected, can't tell the date either date = '' else: date = '{:02}/{:02}/{}'.format( # get date from gps gps.timestamp_utc.tm_mon, gps.timestamp_utc.tm_mday, gps.timestamp_utc.tm_year) text_surface = medium_font.render(get_verbose_date(date), True, WHITE) rect = text_surface.get_rect(center=(160,100)) screen.blit(text_surface, rect) # convert date from form '04/30/2022' to form 'April 30, 2022' def get_verbose_date(numeric_date): if numeric_date == '': # corner case when there is no GPS signal return '' parts = numeric_date.split('/') index = int(parts[0])-1 months = ['Jan.', 'Feb.', 'Mar.', 'Apr.', 'May', 'Jun.', 'Jul.', 'Aug.', 'Sep.', 'Oct.', 'Nov.', 'Dec.'] month = months[index] day = parts[1] year = parts[2] return month + ' ' + day + ', ' + year # display data labels on bike screen def display_data_labels(): small_font.set_underline(True) # underline the data labels for text, pos in labels.items(): text_surface = small_font.render(text, True, WHITE) rect = text_surface.get_rect(center=pos) screen.blit(text_surface, rect) small_font.set_underline(False) # display data values on bike screen def display_data(): # display time text_surface = small_font.render(elapsed_time, True, WHITE) x,y = labels['time'] y = y + 30 rect = text_surface.get_rect(center=(x,y)) screen.blit(text_surface, rect) # display distance text_surface = small_font.render(str(round(dist,2)) + ' km', True, WHITE) x,y = labels['distance'] y = y + 30 rect = text_surface.get_rect(center=(x,y)) screen.blit(text_surface, rect) # display altitude text_surface = small_font.render((str(int(altitude))) + ' m', True, WHITE) x,y = labels['altitude'] y = y + 30 rect = text_surface.get_rect(center=(x,y)) screen.blit(text_surface, rect) # display speed text_surface = small_font.render(str(speed) + ' km/h', True, WHITE) x,y = labels['speed'] y = y + 30 rect = text_surface.get_rect(center=(x,y)) screen.blit(text_surface, rect) # display elevation gain text_surface = small_font.render(str(int(elevation_gain)) + ' m', True, WHITE) x,y = labels['elevation gain'] y = y + 30 rect = text_surface.get_rect(center=(x,y)) screen.blit(text_surface, rect) # tell user to move to better location when the GPS is not connecting def tell_user_to_move(): lines = {'GPS not connected.': (160,80), 'Move to location with clear sky.': (160,100)} for text, pos in lines.items(): text_surface = small_font.render(text, True, WHITE) rect = text_surface.get_rect(center=pos) screen.blit(text_surface, rect) # update altitude displayed to the user def update_altitude(): global altitude if gps.altitude_m is not None: altitude = gps.altitude_m # update the elevation gain displayed to the user def update_elevation_gain(): global elevation_gain, first_val_alt, prev_altitude current_altitude = gps.altitude_m if first_val_alt: # if very first measurement, set current = previous prev_altitude = current_altitude first_val_alt = False altitude_diff = current_altitude - prev_altitude print("Altitude difference: " + str(altitude_diff)) if abs(altitude_diff) > 3: # only record altitude changes of greater than 3 m to reduce jitter prev_altitude = current_altitude if altitude_diff > 0: # only positive elevation changes contribute to gain elevation_gain += altitude_diff print("Total elevation gain: " + str(elevation_gain)) # update speed displayed to the user def update_speed(): global speed if gps.speed_knots is not None: if gps.speed_knots > 1: speed = round(gps.speed_knots * 1.150779,1) # convert knots to km/h else: speed = 0 # update distance displayed to the user def update_distance(): global dist, first_val, prev_latitude, prev_longitude lat = gps.latitude lon = gps.longitude coord1 = (lat,lon) if first_val: # if very first measurement, set current = previous prev_latitude = lat prev_longitude = lon first_val = False coord2 = (prev_latitude,prev_longitude) del_dist = distance.distance(coord1,coord2).km print("Distance difference: " + str(del_dist)) if del_dist >= 0.05: # only update when 50 m change in position is detected to reduce jitter dist += del_dist print("Total distance: " + str(dist)) prev_latitude = lat # current values become previous values in the next iteration prev_longitude = lon # update the elapsed time displayed to the user def update_elapsed_time(): global elapsed_time time_diff = int(time.monotonic()-ref_time) + prev_time hours = int(time_diff/3600) minutes = int((time_diff-(hours*3600))/60) seconds = time_diff%60 elapsed_time = '{:02}:{:02}:{:02}'.format(hours, minutes, seconds) # saves data for the current activity in a file def write_activity_to_file(): global date, time_of_day, dist, elapsed_time, elevation_gain # convert time to 24-hour format to alphabetize file names if 'AM' in time_of_day: time_24hr = time_of_day[:-3] else: i = time_of_day.index(':') time_24hr = str(int(time_of_day[:i])+12) + time_of_day[i:-3] filename = date.replace('/','-') + '_' + time_24hr with open('/home/pi/final_project/activities/' + filename, 'w') as file: file.write('Date: ' + get_verbose_date(date) + '\n') i = time_of_day.rindex(':') file.write('Time of day: ' + time_of_day[:i] + time_of_day[i+3:] + '\n') file.write('Distance: ' + str(round(dist,1)) + ' km \n') file.write('Elapsed time: ' + elapsed_time + '\n') file.write('Elevation gain: ' + str(int(elevation_gain)) + ' m \n') # resets the user interface to its initial state def reset_system(): global altitude, elevation_gain, prev_altitude, speed, dist, prev_latitude global prev_longitude, ref_time, prev_time, first_val_alt, first_val, elapsed_time global start, pause, on_home_screen, on_bike_screen, on_history_screen, on_summary_screen, on_graph_screen altitude = elevation_gain = prev_altitude = speed = dist = 0 prev_latitude = prev_longitude = ref_time = prev_time = 0 first_val_alt = first_val = True elapsed_time = '00:00:00' start = pause = False on_home_screen = True on_bike_screen = on_history_screen = on_summary_screen = on_graph_screen = False # plot and save bar graph def plot_bars(x_axis, y_axis, title, filename): matplotlib.rcParams.update({'font.size': 10, 'text.color' : 'white', 'xtick.color': 'white', 'ytick.color': 'white'}) fig = plt.figure(figsize = (3,2), facecolor='black') plt.bar(x_axis, y_axis, color = 'maroon', width=0.4) plt.title(title) plt.savefig(filename) plt.close() # write weekly totals for a particular week to a summary file def write_summary_to_file(dist_sum, time_sum, elev_sum, start_date, end_date): hours = int((time_sum/60)) mins = time_sum%60 with open('/home/pi/final_project/summaries/' + start_date.replace('/','-'), 'w') as file: file.write(get_verbose_date(start_date) + ' to ' + get_verbose_date(end_date) + '\n') file.write('Total distance: ' + str(dist_sum) + ' km \n') file.write('Total time: ' + str(hours) + ' hours ' + str(mins) + ' mins \n') file.write('Total elevation gain: ' + str(elev_sum) + ' m \n') # compute the start date of the week that an activity is in def get_start_of_week(activity_filename): activity_datetime = activity_filename.split('-') activity_datetime = datetime.datetime(int(activity_datetime[2][:4]),int(activity_datetime[0]),int(activity_datetime[1])) day_of_week = activity_datetime.weekday() start_of_week = activity_datetime - datetime.timedelta(day_of_week) # start date of current week return start_of_week # create graphs and weekly totals for distance, time, and elevation gain data def summarize_data(): global activities x_axis = ['M', 'Tu', 'W', 'Th', 'F', 'Sa', 'Su'] dist_vals = [0]*7 # store distance per weekday time_vals = [0]*7 # time per weekday elev_vals = [0]*7 # elevation gain per weekday for i in range(len(activities)): # get date of activity as a datetime object activity_datetime = activities[i].split('-') activity_datetime = datetime.datetime(int(activity_datetime[2][:4]),int(activity_datetime[0]),int(activity_datetime[1])) day_of_week = activity_datetime.weekday() start_of_week = activity_datetime - datetime.timedelta(day_of_week) # start date of current week end_of_week = activity_datetime + datetime.timedelta(6-day_of_week) # end date of current week with open('/home/pi/final_project/activities/' + activities[i], 'r') as file: lines = file.readlines() for line in lines: if 'Distance' in line: dist_vals[day_of_week] += float(line.split(' ')[1]) if 'Elapsed time' in line: time_str = line.split(' ')[2] time_str = time_str.split(':') hours = int(time_str[0]) mins = int(time_str[1]) secs = int((time_str[2])[:-1]) # remove newline character from this string time_in_mins = (secs + mins*60 + hours*3600)/60 time_vals[day_of_week] += time_in_mins if 'Elevation gain' in line: elev_vals[day_of_week] += float(line.split(' ')[2]) # if there are no more activity files or the next activity belongs to a different week if i == (len(activities)-1) or start_of_week != get_start_of_week(activities[i+1]): # get start and end dates of week start_date = start_of_week.strftime('%m/%d/%Y') end_date = end_of_week.strftime('%m/%d/%Y') # plot and store bar graphs for that week plot_bars(x_axis, dist_vals, 'Distance (km)', '/home/pi/final_project/graphs/dist_graphs/' + start_date.replace('/','-') + '.png') plot_bars(x_axis, time_vals, 'Time (mins)', '/home/pi/final_project/graphs/time_graphs/' + start_date.replace('/','-') + '.png') plot_bars(x_axis, elev_vals, 'Elevation gain (m)', '/home/pi/final_project/graphs/elev_graphs/' + start_date.replace('/','-') + '.png') # write a summary file for that week dist_sum = sum(dist_vals) time_sum = int(sum(time_vals)) elev_sum = int(sum(elev_vals)) write_summary_to_file(dist_sum, time_sum, elev_sum, start_date, end_date) # reset arrays for the following week dist_vals = [0]*7 # store distance per weekday time_vals = [0]*7 # time per weekday elev_vals = [0]*7 # elevation gain per weekday while code_running: time.sleep(0.2) if (not GPIO.input(27)): # if quit button is pressed, end program code_running = False screen.fill(BLACK) # erase workspace # get new data from GPS every second current_time = time.monotonic() if current_time - last_time >= 1.0: last_time = current_time gps.update() # user is on the home screen if on_home_screen: display_time_of_day() display_date() # draw home screen buttons for image, position in home_screen_buttons.items(): rect = image.get_rect(center=position) screen.blit(image, rect) # check if buttons were pressed for event in pygame.event.get(): if (event.type is MOUSEBUTTONUP): pos = pygame.mouse.get_pos() for (image, rect) in home_screen_button_rects.items(): if (rect.collidepoint(pos)): if (image == bike): # enter bike screen on_home_screen = on_history_screen = on_summary_screen = on_graph_screen = False on_bike_screen = True screen.fill(BLACK) # erase workspace elif (image == history): # enter history screen on_home_screen = on_bike_screen = on_summary_screen = on_graph_screen = False on_history_screen = True activities = os.listdir('/home/pi/final_project/activities/') # get names of activity files activities.sort() # list from least to most recent screen_num = len(activities)-1 # always start by showing most recent activity screen.fill(BLACK) # erase workspace elif (image == summary): # enter summary screen on_home_screen = on_bike_screen = on_history_screen = on_graph_screen = False on_summary_screen = True summaries = os.listdir('/home/pi/final_project/summaries/') # get names of activities summaries.sort() # list from least to most recent screen_num = len(summaries)-1 # always start by showing most recent summary screen.fill(BLACK) # erase workspace # user is on the bike screen if on_bike_screen: if not gps.has_fix: # if GPS not connected, tell user to move tell_user_to_move() # draw back button for text, position in bike_screen_buttons.items(): if text == 'back': text_surface = small_font.render(text, True, WHITE) rect = text_surface.get_rect(center=position) screen.blit(text_surface, rect) # check if back button was pressed for event in pygame.event.get(): if (event.type is MOUSEBUTTONUP): pos = pygame.mouse.get_pos() for (text, rect) in bike_screen_button_rects.items(): if (text != 'start') and (text != 'pause') and (text != 'save') and (rect.collidepoint(pos)): if (text == 'back'): # press back button to return to home screen on_home_screen = True on_bike_screen = on_history_screen = on_summary_screen = on_graph_screen = False screen.fill(BLACK) # erase workspace else: display_data_labels() display_data() update_altitude() update_speed() # if waiting for user to start the activity if not start: # draw back and start buttons for text, position in bike_screen_buttons.items(): if text != 'pause' and text != 'save': text_surface = small_font.render(text, True, WHITE) rect = text_surface.get_rect(center=position) screen.blit(text_surface, rect) # check if buttons were pressed for event in pygame.event.get(): if (event.type is MOUSEBUTTONUP): pos = pygame.mouse.get_pos() for (text, rect) in bike_screen_button_rects.items(): if (text != 'pause') and text != 'save' and (rect.collidepoint(pos)): if (text == 'back'): # press back button to return to home screen on_home_screen = True on_bike_screen = on_history_screen = on_summary_screen = on_graph_screen = False screen.fill(BLACK) # erase workspace elif (text == 'start'): # start recording activity start = True ref_time = time.monotonic() # store current time to be the reference time else: # user has started the activity if not pause: # activity is not paused update_elapsed_time() update_distance() update_elevation_gain() # draw save and pause buttons buttons for text, position in bike_screen_buttons.items(): if text != 'start' and text != 'back': text_surface = small_font.render(text, True, WHITE) rect = text_surface.get_rect(center=position) screen.blit(text_surface, rect) # check if buttons were pressed for event in pygame.event.get(): if (event.type is MOUSEBUTTONUP): pos = pygame.mouse.get_pos() for (text, rect) in bike_screen_button_rects.items(): if (text != 'start') and (text != 'back') and (rect.collidepoint(pos)): if (text == 'save'): # save activity, reset system, and summarize all past data write_activity_to_file() reset_system() activities = os.listdir('/home/pi/final_project/activities/') # get names of activities activities.sort() # show activities from least to most recent summarize_data() screen.fill(BLACK) # erase workspace elif (text == 'pause'): # pause recording of activity pause = True else: # activity is paused # draw save and start buttons for text, position in bike_screen_buttons.items(): if text != 'pause' and text != 'back': text_surface = small_font.render(text, True, WHITE) rect = text_surface.get_rect(center=position) screen.blit(text_surface, rect) # check if buttons were pressed for event in pygame.event.get(): if (event.type is MOUSEBUTTONUP): pos = pygame.mouse.get_pos() for (text, rect) in bike_screen_button_rects.items(): if (text != 'pause') and (text != 'back') and (rect.collidepoint(pos)): if (text == 'save'): # save activity, reset system, and summarize all past data write_activity_to_file() reset_system() activities = os.listdir('/home/pi/final_project/activities/') # get names of activities activities.sort() # show activities from least to most recent summarize_data() screen.fill(BLACK) # erase workspace elif (text == 'start'): # start recording again pause = False prev_time = int(elapsed_time[:2])*3600 + int(elapsed_time[3:5])*60 + int(elapsed_time[6:]) ref_time = time.monotonic() first_val = True first_val_alt = True if on_history_screen: # users can go here to view past activities # draw arrow buttons for image, position in arrow_buttons.items(): rect = image.get_rect(center=position) screen.blit(image, rect) # check if buttons were pressed for event in pygame.event.get(): if (event.type is MOUSEBUTTONUP): pos = pygame.mouse.get_pos() for (image, rect) in arrow_button_rects.items(): if (rect.collidepoint(pos)): if (image == left_arrow) and (len(activities) > 0): # view less recent activity screen_num = (screen_num-1)%len(activities) elif (image == right_arrow) and (len(activities) > 0): # view more recent activity screen_num = (screen_num+1)%len(activities) elif (image == home): # return to home screen on_home_screen = True on_bike_screen = on_history_screen = on_summary_screen = on_graph_screen = False screen.fill(BLACK) # erase workspace if (len(activities) > 0): # if there is at least one activity, display past activities with open('/home/pi/final_project/activities/' + activities[screen_num], 'r') as file: lines = file.readlines() y = 0 for line in lines: text_surface = small_font.render(line[:-1], True, WHITE) rect = text_surface.get_rect(topleft=(0,y)) screen.blit(text_surface, rect) y += 33 if on_summary_screen: # users can go here to view summarized data from past activities if (len(summaries) > 0): # if there is at least one summary, display past summaries with open('/home/pi/final_project/summaries/' + summaries[screen_num], 'r') as file: lines = file.readlines() y = 0 for line in lines: if y == 0: # underline date range of the week small_font.set_underline(True) text_surface = small_font.render(line[:-1], True, WHITE) rect = text_surface.get_rect(center=(160,15)) small_font.set_underline(False) else: text_surface = small_font.render(line[:-1], True, WHITE) rect = text_surface.get_rect(topleft=(0,y)) screen.blit(text_surface, rect) y += 38 # draw arrow buttons for image, position in arrow_buttons.items(): rect = image.get_rect(center=position) screen.blit(image, rect) # draw buttons to select graphs for image, position in graph_selection_buttons.items(): rect = image.get_rect(center=position) screen.blit(image, rect) # check if buttons were pressed for event in pygame.event.get(): if (event.type is MOUSEBUTTONUP): pos = pygame.mouse.get_pos() for (image, rect) in arrow_button_rects.items(): if (rect.collidepoint(pos)): if (image == left_arrow) and (len(summaries) > 0): # view less recent summary screen_num = (screen_num-1)%len(summaries) elif (image == right_arrow) and (len(summaries) > 0): # view more recent summary screen_num = (screen_num+1)%len(summaries) elif (image == home): # return to home screen on_home_screen = True on_bike_screen = on_history_screen = on_summary_screen = on_graph_screen = False screen.fill(BLACK) # erase workspace for (image, rect) in graph_selection_button_rects.items(): if (rect.collidepoint(pos)): on_graph_screen = True on_bike_screen = on_history_screen = on_summary_screen = on_home_screen = False if (image == dist_graph): # display distance graph graph_path = '/home/pi/final_project/graphs/dist_graphs/' elif (image == time_graph): # display time graph graph_path = '/home/pi/final_project/graphs/time_graphs/' elif (image == elev_graph): # display elevation gain graph graph_path = '/home/pi/final_project/graphs/elev_graphs/' graphs = os.listdir(graph_path) graphs.sort() screen.fill(BLACK) # erase workspace if on_graph_screen: # screen that displays graphical summaries # draw arrow buttons for image, position in arrow_buttons.items(): rect = image.get_rect(center=position) screen.blit(image, rect) # check if buttons were pressed for event in pygame.event.get(): if (event.type is MOUSEBUTTONUP): pos = pygame.mouse.get_pos() for (image, rect) in arrow_button_rects.items(): if (rect.collidepoint(pos)): if (image == left_arrow): # view less recent graph screen_num = (screen_num-1)%len(summaries) # note than len(summaries) == len(graphs) elif (image == right_arrow): # view more recent graph screen_num = (screen_num+1)%len(summaries) elif (image == home): # return to summary screen on_summary_screen = True on_bike_screen = on_history_screen = on_home_screen = on_graph_screen = False screen.fill(BLACK) # erase workspace graph = pygame.image.load(graph_path + graphs[screen_num]) screen.blit(graph, graph.get_rect(center=(160,100))) pygame.display.flip() # display everything that has been blitted GPIO.cleanup() # always clean up GPIO when program terminates |
Work Distribution

Photo of Maanav (left) and Morgan (right).
Both team members were actively involved in all parts of this project. Almost all of the code was written doing pair programming, and tests were also conducted together. Both members were also involved in writing all sections of this report. Morgan focused a bit more on discussing the distance calculation algorithm and history screen. Maanav focused a bit more on discussing the implementation of the summary and graph screens.